|
1100
|
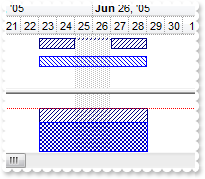
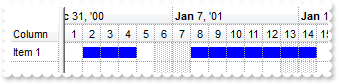
Is it is possible to exclude the non-working days when displaying the histogram using the exBarEffort for exHistOverAllocation type
OleObject oG2antt,var_Bar,var_Bar1,var_Bar2,var_Chart,var_Items
any h

oG2antt = ole_1.Object
oG2antt.BeginUpdate()
oG2antt.Columns.Add("Tasks")
var_Chart = oG2antt.Chart
	var_Chart.LevelCount = 2
	var_Chart.PaneWidth(false,40)
	var_Chart.FirstVisibleDate = 2005-06-20
	var_Chart.HistogramVisible = true
	var_Chart.HistogramHeight = 64
	var_Chart.HistogramView = 112
	var_Bar = var_Chart.Bars.Item("Split")
		var_Bar.Pattern = 6
		var_Bar.Shape = 18
		var_Bar.Color = RGB(0,0,128)
	var_Bar1 = var_Chart.Bars.Add("Task:Split")
		var_Bar1.Color = RGB(0,0,128)
		var_Bar1.Shortcut = "WorkingTask"
		var_Bar1.Pattern = 6
		var_Bar1.HistogramPattern = 6
		var_Bar1.HistogramType = 1
	var_Bar2 = var_Chart.Bars.Item("Task")
		var_Bar2.Color = RGB(0,0,255)
		var_Bar2.Pattern = 5
		var_Bar2.HistogramType = 1
		var_Bar2.HistogramPattern = 5
var_Items = oG2antt.Items
	h = var_Items.AddItem("True")
	var_Items.AddBar(h,"WorkingTask",2005-06-23,2005-06-29)
	var_Items.ItemBar(h,"",21,4)
	var_Items.ItemBar(h,"",20,true)
	h = var_Items.AddItem("False")
	var_Items.AddBar(h,"Task",2005-06-23,2005-06-29)
	var_Items.ItemBar(h,"",21,4)
	var_Items.ItemBar(h,"",20,false)
oG2antt.EndUpdate()
|
|
1099
|
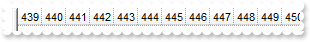
I display numbers in my chart, but the AddBar requires a date how can I add a bar
OleObject oG2antt,var_Chart,var_Items,var_Level

oG2antt = ole_1.Object
oG2antt.BeginUpdate()
oG2antt.Columns.Add("Tasks")
var_Chart = oG2antt.Chart
	var_Chart.PaneWidth(false,0)
	var_Chart.NonworkingDays = 0
	var_Chart.FirstVisibleDate = 0
	var_Chart.ToolTip = ""
	var_Level = var_Chart.Level(0)
		var_Level.Label = "<%i%>"
		var_Level.ToolTip = ""
	var_Chart.UnitWidth = 24
var_Items = oG2antt.Items
	var_Items.AddBar(var_Items.AddItem("Task 1"),"Task",2,4)
	var_Items.AddBar(var_Items.AddItem("Task 2"),"Task",6,10)
oG2antt.EndUpdate()
|
|
1098
|
I display numbers in the chart's header but do not want to get displayed negative numbers. How can i do that
/*begin event DateChange() - Occurs when the first visible date is changed.*/
/*
	oG2antt = ole_1.Object
	oG2antt.Chart.FirstVisibleDate = 0
	oG2antt.ScrollPartEnable(2,1024,false)
*/
/*end event DateChange*/

OleObject oG2antt,var_Chart,var_Level

oG2antt = ole_1.Object
oG2antt.BeginUpdate()
var_Chart = oG2antt.Chart
	var_Chart.PaneWidth(false,0)
	var_Chart.NonworkingDays = 0
	var_Chart.FirstVisibleDate = 0
	var_Chart.ToolTip = ""
	var_Level = var_Chart.Level(0)
		var_Level.Label = "<%i%>"
		var_Level.ToolTip = "<%i%>"
	var_Chart.UnitWidth = 24
oG2antt.EndUpdate()
|
|
1097
|
How can I display numbers in the chart's header instead dates
OleObject oG2antt,var_Chart,var_Level

oG2antt = ole_1.Object
oG2antt.BeginUpdate()
var_Chart = oG2antt.Chart
	var_Chart.PaneWidth(false,0)
	var_Chart.NonworkingDays = 0
	var_Chart.FirstVisibleDate = 0
	var_Chart.ToolTip = ""
	var_Level = var_Chart.Level(0)
		var_Level.Label = "<%i%>"
		var_Level.ToolTip = ""
	var_Chart.UnitWidth = 24
oG2antt.EndUpdate()
|
|
1096
|
How can I create a bar that's not sizable, or can not be resized by default similar with milestone
OleObject oG2antt,var_Bar,var_Chart,var_Items

oG2antt = ole_1.Object
oG2antt.BeginUpdate()
oG2antt.Columns.Add("Task")
var_Chart = oG2antt.Chart
	var_Chart.PaneWidth(false,0)
	var_Chart.FirstVisibleDate = 2000-12-24
	var_Chart.LevelCount = 2
	var_Bar = var_Chart.Bars.Add("Custom")
		var_Bar.Shape = 0
		var_Bar.StartShape = 1
		var_Bar.EndShape = 0
var_Items = oG2antt.Items
	var_Items.AddBar(var_Items.AddItem(""),"Custom",2001-01-02,2001-01-02,"K1","This TYPE of bar can not be resized.")
oG2antt.EndUpdate()
|
|
1095
|
Is it possible to hide the non-working parts for items using the ItemNonworkingUnits, even if set the ShowNonworkingUnits, ShowNonworkingDates on False
OleObject oG2antt,var_Chart,var_Items
any h1,h2,h3

oG2antt = ole_1.Object
oG2antt.BeginUpdate()
oG2antt.Columns.Add("Task")
var_Chart = oG2antt.Chart
	var_Chart.Bars.Add("Task:Split").Shortcut = "Task"
	var_Chart.FirstVisibleDate = 2000-12-27
	var_Chart.PaneWidth(false,64)
	var_Chart.LevelCount = 2
	var_Chart.ShowNonworkingUnits = false
	var_Chart.ShowNonworkingDates = false
	var_Chart.NonworkingDaysPattern = 0
var_Items = oG2antt.Items
	h1 = var_Items.AddItem("Task 1")
	var_Items.AddBar(h1,"Task",2001-01-02,2001-01-04,"K1")
	h2 = var_Items.AddItem("Task 2")
	var_Items.ItemNonworkingUnits(h2,false,"weekday(value) = 1")
	var_Items.AddBar(h2,"Task",2001-01-04,2001-01-06,"K2")
	var_Items.AddLink("L1",h1,"K1",h2,"K2")
	h3 = var_Items.AddItem("Task 3")
	var_Items.AddBar(h3,"Task",2001-01-08,2001-01-10,"K3")
	var_Items.AddLink("L2",h2,"K2",h3,"K3")
oG2antt.EndUpdate()
|
|
1094
|
Is it possible to show the non-working parts for certain items, even if I hide the default non-working part
OleObject oG2antt,var_Chart,var_Items
any h1,h2,h3

oG2antt = ole_1.Object
oG2antt.BeginUpdate()
oG2antt.Columns.Add("Task")
var_Chart = oG2antt.Chart
	var_Chart.Bars.Add("Task:Split").Shortcut = "Task"
	var_Chart.FirstVisibleDate = 2000-12-27
	var_Chart.PaneWidth(false,64)
	var_Chart.LevelCount = 2
	var_Chart.ShowNonworkingUnits = false
	var_Chart.ShowNonworkingDates = false
var_Items = oG2antt.Items
	h1 = var_Items.AddItem("Task 1")
	var_Items.AddBar(h1,"Task",2001-01-02,2001-01-04,"K1")
	h2 = var_Items.AddItem("Task 2")
	var_Items.ItemNonworkingUnits(h2,false,"weekday(value) = 1")
	var_Items.AddBar(h2,"Task",2001-01-04,2001-01-06,"K2")
	var_Items.AddLink("L1",h1,"K1",h2,"K2")
	h3 = var_Items.AddItem("Task 3")
	var_Items.AddBar(h3,"Task",2001-01-08,2001-01-10,"K3")
	var_Items.AddLink("L2",h2,"K2",h3,"K3")
oG2antt.EndUpdate()
|
|
1093
|
How can I hide the non-working part of the chart
OleObject oG2antt,var_Chart

oG2antt = ole_1.Object
oG2antt.BeginUpdate()
var_Chart = oG2antt.Chart
	var_Chart.FirstVisibleDate = 2008-01-01
	var_Chart.PaneWidth(false,0)
	var_Chart.LevelCount = 2
	var_Chart.ShowNonworkingUnits = false
	var_Chart.ShowNonworkingDates = false
oG2antt.EndUpdate()
|
|
1092
|
Is it possible to let users selects cells as in Excel
OleObject oG2antt,var_Column,var_Column1,var_Column2,var_Columns,var_Items
any h,h1

oG2antt = ole_1.Object
oG2antt.BeginUpdate()
oG2antt.FullRowSelect = 1
oG2antt.SingleSel = false
oG2antt.ReadOnly = -1
oG2antt.MarkSearchColumn = false
oG2antt.ShowFocusRect = false
oG2antt.LinesAtRoot = -1
oG2antt.SelForeColor = RGB(0,0,0)
oG2antt.SelBackColor = RGB(200,225,242)
var_Columns = oG2antt.Columns
	var_Columns.Add("A")
	var_Column = var_Columns.Add("B")
		var_Column.AllowSizing = false
		var_Column.Width = 24
	var_Column1 = var_Columns.Add("C")
		var_Column1.AllowSizing = false
		var_Column1.Width = 24
		var_Column1.Def(0,1)
		var_Column1.PartialCheck = true
	var_Column2 = var_Columns.Add("D")
		var_Column2.AllowSizing = false
		var_Column2.Width = 24
		var_Column2.Def(1,1)
var_Items = oG2antt.Items
	h = var_Items.InsertItem(,,"Group 1")
	h1 = var_Items.InsertItem(h,,16)
	var_Items.CellValue(h1,1,17)
	h1 = var_Items.InsertItem(h,,2)
	var_Items.CellValue(h1,1,11)
	h1 = var_Items.InsertItem(h,,2)
	var_Items.ItemBackColor(h1,RGB(240,240,240))
	var_Items.CellValue(h1,1,9)
	var_Items.ExpandItem(h,true)
	h = var_Items.InsertItem(,,"Group 2")
	var_Items.CellValueFormat(h,2,1)
	h1 = var_Items.InsertItem(h,,16)
	var_Items.CellValue(h1,1,9)
	h1 = var_Items.InsertItem(h,,12)
	var_Items.CellValue(h1,1,11)
	h1 = var_Items.InsertItem(h,,2)
	var_Items.CellValue(h1,1,2)
	var_Items.ExpandItem(h,true)
	var_Items.SelectItem(h,true)
oG2antt.EndUpdate()
|
|
1091
|
How can I hide a date from the chart view
OleObject oG2antt,var_Chart,var_InsideZooms

oG2antt = ole_1.Object
oG2antt.BeginUpdate()
var_Chart = oG2antt.Chart
	var_Chart.FirstVisibleDate = 2008-01-01
	var_Chart.PaneWidth(false,0)
	var_Chart.LevelCount = 2
	var_Chart.AllowInsideZoom = true
	var_Chart.AllowResizeInsideZoom = false
	var_Chart.InsideZoomOnDblClick = false
	var_InsideZooms = var_Chart.InsideZooms
		var_InsideZooms.SplitBaseLevel = false
		var_InsideZooms.DefaultWidth = 0
		var_InsideZooms.Add(2008-01-04)
		var_InsideZooms.Add(2008-01-05)
		var_InsideZooms.Add(2008-01-06)
	var_Chart.SelectLevel = 1
	var_Chart.SelectDate(2008-01-05,true)
oG2antt.EndUpdate()
|
|
1090
|
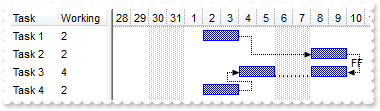
Can the SchedulePDM displays and edit the working units for my bars
/*begin event BarResizing(long  Item, any  Key) - Occurs when a bar is moving or resizing.*/
/*
	oG2antt = ole_1.Object
	oG2antt.Items.SchedulePDM(Item,Key)
*/
/*end event BarResizing*/

OleObject oG2antt,var_Chart,var_Column,var_Items
any h1,h2,h3,h4

oG2antt = ole_1.Object
oG2antt.BeginUpdate()
oG2antt.Items.AllowCellValueToItemBar = true
oG2antt.Columns.Add("Task")
var_Column = oG2antt.Columns.Add("Working")
	var_Column.Def(18,258)
	var_Column.Editor.EditType = 4
var_Chart = oG2antt.Chart
	var_Chart.Bars.Add("Task:Split").Shortcut = "Task"
	var_Chart.FirstVisibleDate = 2000-12-28
	var_Chart.PaneWidth(false,96)
	var_Chart.AllowLinkBars = false
	var_Chart.AllowCreateBar = 0
var_Items = oG2antt.Items
	h1 = var_Items.AddItem("Task 1")
	var_Items.AddBar(h1,"Task",2001-01-02,2001-01-04,"")
	h2 = var_Items.AddItem("Task 2")
	var_Items.AddBar(h2,"Task",2001-01-02,2001-01-04,"")
	var_Items.AddLink("L1",h1,"",h2,"")
	h3 = var_Items.AddItem("Task 3")
	var_Items.AddBar(h3,"Task",2001-01-02,2001-01-06,"")
	var_Items.AddLink("L2",h2,"",h3,"")
	var_Items.Link("L2",12,"FF")
	var_Items.Link("L2",6,2)
	var_Items.Link("L2",7,2)
	h4 = var_Items.AddItem("Task 4")
	var_Items.AddBar(h4,"Task",2001-01-02,2001-01-04,"")
	var_Items.AddLink("L3",h4,"",h3,"")
	var_Items.ItemBar(0,"<*>",20,true)
	var_Items.SchedulePDM(var_Items.FirstVisibleItem,"")
oG2antt.EndUpdate()
|
|
1089
|
Can the SchedulePDM displays the working units for my bars
/*begin event BarResizing(long  Item, any  Key) - Occurs when a bar is moving or resizing.*/
/*
	oG2antt = ole_1.Object
	oG2antt.Items.SchedulePDM(Item,Key)
*/
/*end event BarResizing*/

OleObject oG2antt,var_Chart,var_Items
any h1,h2,h3,h4

oG2antt = ole_1.Object
oG2antt.BeginUpdate()
oG2antt.Items.AllowCellValueToItemBar = true
oG2antt.Columns.Add("Task")
oG2antt.Columns.Add("Working").Def(18,258)
var_Chart = oG2antt.Chart
	var_Chart.Bars.Add("Task:Split").Shortcut = "Task"
	var_Chart.FirstVisibleDate = 2000-12-28
	var_Chart.PaneWidth(false,96)
	var_Chart.AllowLinkBars = false
	var_Chart.AllowCreateBar = 0
var_Items = oG2antt.Items
	h1 = var_Items.AddItem("Task 1")
	var_Items.AddBar(h1,"Task",2001-01-02,2001-01-04,"")
	h2 = var_Items.AddItem("Task 2")
	var_Items.AddBar(h2,"Task",2001-01-02,2001-01-04,"")
	var_Items.AddLink("L1",h1,"",h2,"")
	h3 = var_Items.AddItem("Task 3")
	var_Items.AddBar(h3,"Task",2001-01-02,2001-01-06,"")
	var_Items.AddLink("L2",h2,"",h3,"")
	var_Items.Link("L2",12,"FF")
	var_Items.Link("L2",6,2)
	var_Items.Link("L2",7,2)
	h4 = var_Items.AddItem("Task 4")
	var_Items.AddBar(h4,"Task",2001-01-02,2001-01-04,"")
	var_Items.AddLink("L3",h4,"",h3,"")
	var_Items.ItemBar(0,"<*>",20,true)
	var_Items.SchedulePDM(var_Items.FirstVisibleItem,"")
oG2antt.EndUpdate()
|
|
1088
|
Can the SchedulePDM keeps the working units for my bars
/*begin event BarResizing(long  Item, any  Key) - Occurs when a bar is moving or resizing.*/
/*
	oG2antt = ole_1.Object
	oG2antt.Items.SchedulePDM(Item,Key)
*/
/*end event BarResizing*/

OleObject oG2antt,var_Chart,var_Items
any h1,h2,h3,h4

oG2antt = ole_1.Object
oG2antt.BeginUpdate()
oG2antt.Columns.Add("Task")
var_Chart = oG2antt.Chart
	var_Chart.Bars.Add("Task:Split").Shortcut = "Task"
	var_Chart.FirstVisibleDate = 2000-12-28
	var_Chart.PaneWidth(false,48)
	var_Chart.AllowLinkBars = false
	var_Chart.AllowCreateBar = 0
var_Items = oG2antt.Items
	h1 = var_Items.AddItem("Task 1")
	var_Items.AddBar(h1,"Task",2001-01-02,2001-01-04,"K1")
	h2 = var_Items.AddItem("Task 2")
	var_Items.AddBar(h2,"Task",2001-01-02,2001-01-04,"K2")
	var_Items.AddLink("L1",h1,"K1",h2,"K2")
	h3 = var_Items.AddItem("Task 3")
	var_Items.AddBar(h3,"Task",2001-01-02,2001-01-06,"K3")
	var_Items.AddLink("L2",h2,"K2",h3,"K3")
	var_Items.Link("L2",12,"FF")
	var_Items.Link("L2",6,2)
	var_Items.Link("L2",7,2)
	h4 = var_Items.AddItem("Task 4")
	var_Items.AddBar(h4,"Task",2001-01-02,2001-01-04,"K4")
	var_Items.AddLink("L3",h4,"K4",h3,"K3")
	var_Items.ItemBar(0,"<*>",20,true)
	var_Items.SchedulePDM(0,"K1")
oG2antt.EndUpdate()
|
|
1087
|
How can I arrange automatically the bars based on their links as soon as user moves the bars
/*begin event BarResizing(long  Item, any  Key) - Occurs when a bar is moving or resizing.*/
/*
	oG2antt = ole_1.Object
	oG2antt.Items.SchedulePDM(Item,Key)
*/
/*end event BarResizing*/

OleObject oG2antt,var_Chart,var_Items
any h1,h2,h3,h4

oG2antt = ole_1.Object
oG2antt.BeginUpdate()
oG2antt.Columns.Add("Task")
var_Chart = oG2antt.Chart
	var_Chart.FirstVisibleDate = 2000-12-28
	var_Chart.PaneWidth(false,48)
	var_Chart.AllowLinkBars = false
	var_Chart.AllowCreateBar = 0
var_Items = oG2antt.Items
	h1 = var_Items.AddItem("Task 1")
	var_Items.AddBar(h1,"Task",2001-01-02,2001-01-04,"K1")
	h2 = var_Items.AddItem("Task 2")
	var_Items.AddBar(h2,"Task",2001-01-02,2001-01-04,"K2")
	var_Items.AddLink("L1",h1,"K1",h2,"K2")
	h3 = var_Items.AddItem("Task 3")
	var_Items.AddBar(h3,"Task",2001-01-02,2001-01-06,"K3")
	var_Items.AddLink("L2",h2,"K2",h3,"K3")
	var_Items.Link("L2",12,"FF")
	var_Items.Link("L2",6,2)
	var_Items.Link("L2",7,2)
	h4 = var_Items.AddItem("Task 4")
	var_Items.AddBar(h4,"Task",2001-01-02,2001-01-04,"K4")
	var_Items.AddLink("L3",h4,"K4",h3,"K3")
	var_Items.SchedulePDM(0,"K1")
oG2antt.EndUpdate()
|
|
1086
|
How can I arrange automatically the bars based on their links as soon as user moves the bars
/*begin event BarResize(long  Item, any  Key) - Occurs when a bar is moved or resized.*/
/*
	oG2antt = ole_1.Object
	oG2antt.Items.SchedulePDM(Item,Key)
*/
/*end event BarResize*/

OleObject oG2antt,var_Chart,var_Items
any h1,h2,h3

oG2antt = ole_1.Object
oG2antt.BeginUpdate()
oG2antt.Columns.Add("Task")
var_Chart = oG2antt.Chart
	var_Chart.FirstVisibleDate = 2001-01-01
	var_Chart.PaneWidth(false,48)
	var_Chart.AllowLinkBars = false
	var_Chart.AllowCreateBar = 0
var_Items = oG2antt.Items
	h1 = var_Items.AddItem("Task 1")
	var_Items.AddBar(h1,"Task",2001-01-02,2001-01-04,"K1")
	h2 = var_Items.AddItem("Task 2")
	var_Items.AddBar(h2,"Task",2001-01-02,2001-01-04,"K2")
	var_Items.AddLink("L1",h1,"K1",h2,"K2")
	h3 = var_Items.AddItem("Task 3")
	var_Items.AddBar(h3,"Task",2001-01-02,2001-01-04,"K3")
	var_Items.AddLink("L2",h2,"K2",h3,"K3")
	var_Items.SchedulePDM(0,"K1")
oG2antt.EndUpdate()
|
|
1085
|
I have some buttons added on the control's scroll bar, how can I can know when the button is being clicked
/*begin event ScrollButtonClick(long  ScrollBar, long  ScrollPart) - Occurs when the user clicks a button in the scrollbar.*/
/*
	oG2antt = ole_1.Object
	MessageBox("Information",string( String(ScrollBar) ))
	MessageBox("Information",string( String(ScrollPart) ))
*/
/*end event ScrollButtonClick*/

OleObject oG2antt

oG2antt = ole_1.Object
oG2antt.ScrollPartVisible(1,32768,true)
oG2antt.ScrollPartVisible(1,16384,true)
oG2antt.ScrollPartVisible(1,1,true)
oG2antt.ScrollPartVisible(1,2,true)
oG2antt.ScrollBars = 5
|
|
1084
|
How do I get notified once the user clicks a hyperlink created using the anchor HTML tag
/*begin event AnchorClick(string  AnchorID, string  Options) - Occurs when an anchor element is clicked.*/
/*
	oG2antt = ole_1.Object
	MessageBox("Information",string( String(AnchorID) ))
	MessageBox("Information",string( String(Options) ))
*/
/*end event AnchorClick*/

OleObject oG2antt,var_Items

oG2antt = ole_1.Object
oG2antt.Columns.Add("Default").Def(17,1)
var_Items = oG2antt.Items
	var_Items.AddItem("This is a link: <aex.com;1>www.exontrol.com</a>")
	var_Items.AddItem("This is a link: <aex.net;2>www.exontrol.net</a>")
|
|
1083
|
Is it possible to start editing a cell when double click it
/*begin event DblClick(integer  Shift, long  X, long  Y) - Occurs when the user dblclk the left mouse button over an object.*/
/*
	oG2antt = ole_1.Object
	oG2antt.Edit()
*/
/*end event DblClick*/

OleObject oG2antt,var_Items,var_Items1

oG2antt = ole_1.Object
oG2antt.BeginUpdate()
oG2antt.AutoEdit = false
oG2antt.MarkSearchColumn = false
oG2antt.Columns.Add("Edit1").Editor.EditType = 1
oG2antt.Columns.Add("Edit2").Editor.EditType = 1
var_Items = oG2antt.Items
	var_Items.CellValue(var_Items.AddItem(1),1,2)
var_Items1 = oG2antt.Items
	var_Items1.CellValue(var_Items1.AddItem(3),1,4)
oG2antt.EndUpdate()
|
|
1082
|
Is it possible to disable standard single-click behavior for this column, so I manually could call Edit() when needed
/*begin event DblClick(integer  Shift, long  X, long  Y) - Occurs when the user dblclk the left mouse button over an object.*/
/*
	oG2antt = ole_1.Object
	oG2antt.Edit()
*/
/*end event DblClick*/

OleObject oG2antt,var_Items,var_Items1

oG2antt = ole_1.Object
oG2antt.BeginUpdate()
oG2antt.AutoEdit = false
oG2antt.MarkSearchColumn = false
oG2antt.Columns.Add("Edit1").Editor.EditType = 1
oG2antt.Columns.Add("Edit2").Editor.EditType = 1
var_Items = oG2antt.Items
	var_Items.CellValue(var_Items.AddItem(1),1,2)
var_Items1 = oG2antt.Items
	var_Items1.CellValue(var_Items1.AddItem(3),1,4)
oG2antt.EndUpdate()
|
|
1081
|
How can I get or restore the old or previously value for the cell being changed
/*begin event Change(long  Item, long  ColIndex, any  NewValue) - Occurs when the user changes the cell's content.*/
/*
	oG2antt = ole_1.Object
	MessageBox("Information",string( "Old-Value:" ))
	MessageBox("Information",string( String(oG2antt.Items.CellValue(Item,ColIndex)) ))
	MessageBox("Information",string( "New-Value:" ))
	MessageBox("Information",string( String(NewValue) ))
*/
/*end event Change*/

OleObject oG2antt,var_Items,var_Items1

oG2antt = ole_1.Object
oG2antt.BeginUpdate()
oG2antt.MarkSearchColumn = false
oG2antt.Columns.Add("Edit1").Editor.EditType = 1
oG2antt.Columns.Add("Edit2").Editor.EditType = 1
var_Items = oG2antt.Items
	var_Items.CellValue(var_Items.AddItem(1),1,2)
var_Items1 = oG2antt.Items
	var_Items1.CellValue(var_Items1.AddItem(3),1,4)
oG2antt.EndUpdate()
|
|
1080
|
How can I display the number of items being found after filtering
/*begin event FilterChange() - Occurs when the filter was changed.*/
/*
	oG2antt = ole_1.Object
	oG2antt.FilterBarCaption = String(oG2antt.Items.VisibleCount)
*/
/*end event FilterChange*/

OleObject oG2antt,var_Columns,var_Items
any h0

oG2antt = ole_1.Object
oG2antt.BeginUpdate()
oG2antt.Chart.PaneWidth(true,0)
oG2antt.ColumnAutoResize = true
oG2antt.ContinueColumnScroll = false
oG2antt.FocusColumnIndex = 1
oG2antt.MarkSearchColumn = false
oG2antt.SearchColumnIndex = 1
oG2antt.FilterBarPromptVisible = true
oG2antt.FilterBarPromptType = 1
oG2antt.FilterBarPromptPattern = "london"
var_Columns = oG2antt.Columns
	var_Columns.Add("Name").Width = 96
	var_Columns.Add("Title").Width = 96
	var_Columns.Add("City")
var_Items = oG2antt.Items
	h0 = var_Items.AddItem("Nancy Davolio")
	var_Items.CellValue(h0,1,"Sales Representative")
	var_Items.CellValue(h0,2,"Seattle")
	h0 = var_Items.AddItem("Andrew Fuller")
	var_Items.CellValue(h0,1,"Vice President, Sales")
	var_Items.CellValue(h0,2,"Tacoma")
	var_Items.SelectItem(h0,true)
	h0 = var_Items.AddItem("Janet Leverling")
	var_Items.CellValue(h0,1,"Sales Representative")
	var_Items.CellValue(h0,2,"Kirkland")
	h0 = var_Items.AddItem("Margaret Peacock")
	var_Items.CellValue(h0,1,"Sales Representative")
	var_Items.CellValue(h0,2,"Redmond")
	h0 = var_Items.AddItem("Steven Buchanan")
	var_Items.CellValue(h0,1,"Sales Manager")
	var_Items.CellValue(h0,2,"London")
	h0 = var_Items.AddItem("Michael Suyama")
	var_Items.CellValue(h0,1,"Sales Representative")
	var_Items.CellValue(h0,2,"London")
	h0 = var_Items.AddItem("Robert King")
	var_Items.CellValue(h0,1,"Sales Representative")
	var_Items.CellValue(h0,2,"London")
	h0 = var_Items.AddItem("Laura Callahan")
	var_Items.CellValue(h0,1,"Inside Sales Coordinator")
	var_Items.CellValue(h0,2,"Seattle")
	h0 = var_Items.AddItem("Anne Dodsworth")
	var_Items.CellValue(h0,1,"Sales Representative")
	var_Items.CellValue(h0,2,"London")
oG2antt.EndUpdate()
|
|
1079
|
How can I highligth the item from the cursor as it moves
/*begin event MouseMove(integer  Button, integer  Shift, long  X, long  Y) - Occurs when the user moves the mouse.*/
/*
	OleObject var_Items
	any h
	oG2antt = ole_1.Object
	oG2antt.BeginUpdate()
	h = oG2antt.ItemFromPoint(-1,-1,c,hit)
	var_Items = oG2antt.Items
		var_Items.ClearItemBackColor(oG2antt.Background(1000 /*0x200 | exHSRight | exListOLEDropPosition*/))
		var_Items.ItemBackColor(h,RGB(240,250,240))
	oG2antt.Background(1000 /*0x200 | exHSRight | exListOLEDropPosition*/,h)
	oG2antt.EndUpdate()
*/
/*end event MouseMove*/

OleObject oG2antt,var_Chart,var_Items
any h

oG2antt = ole_1.Object
oG2antt.BeginUpdate()
oG2antt.LinesAtRoot = -1
oG2antt.DrawGridLines = 1
oG2antt.SelBackColor = RGB(240,250,240)
oG2antt.SelForeColor = RGB(0,0,0)
oG2antt.ShowFocusRect = false
var_Chart = oG2antt.Chart
	var_Chart.SelBackColor = RGB(240,250,240)
oG2antt.Columns.Add("Items")
var_Items = oG2antt.Items
	h = var_Items.AddItem("R1")
	var_Items.InsertItem(h,,"Cell 1.1")
	var_Items.InsertItem(h,,"Cell 1.2")
	var_Items.ExpandItem(h,true)
	h = var_Items.AddItem("R2")
	var_Items.InsertItem(h,,"Cell 2.1")
	var_Items.InsertItem(h,,"Cell 2.2")
	var_Items.ExpandItem(h,true)
oG2antt.EndUpdate()
|
|
1078
|
How can I get the item from the cursor
/*begin event MouseMove(integer  Button, integer  Shift, long  X, long  Y) - Occurs when the user moves the mouse.*/
/*
	any h
	oG2antt = ole_1.Object
	h = oG2antt.ItemFromPoint(-1,-1,c,hit)
	MessageBox("Information",string( "Handle" ))
	MessageBox("Information",string( String(h) ))
	MessageBox("Information",string( "Index" ))
	MessageBox("Information",string( String(oG2antt.Items.ItemToIndex(h)) ))
*/
/*end event MouseMove*/

OleObject oG2antt,var_Items
any h

oG2antt = ole_1.Object
oG2antt.BeginUpdate()
oG2antt.LinesAtRoot = -1
oG2antt.DrawGridLines = 1
oG2antt.Columns.Add("Items")
var_Items = oG2antt.Items
	h = var_Items.AddItem("R1")
	var_Items.InsertItem(h,,"Cell 1.1")
	var_Items.InsertItem(h,,"Cell 1.2")
	var_Items.ExpandItem(h,true)
	h = var_Items.AddItem("R2")
	var_Items.InsertItem(h,,"Cell 2.1")
	var_Items.InsertItem(h,,"Cell 2.2")
	var_Items.ExpandItem(h,true)
oG2antt.EndUpdate()
|
|
1077
|
How can I get the column from the cursor, not only in the header
/*begin event MouseMove(integer  Button, integer  Shift, long  X, long  Y) - Occurs when the user moves the mouse.*/
/*
	oG2antt = ole_1.Object
	MessageBox("Information",string( String(oG2antt.ColumnFromPoint(-1,0)) ))
*/
/*end event MouseMove*/

OleObject oG2antt,var_Items
any h

oG2antt = ole_1.Object
oG2antt.BeginUpdate()
oG2antt.LinesAtRoot = -1
oG2antt.Columns.Add("P1")
oG2antt.Columns.Add("P2")
oG2antt.DrawGridLines = -1
var_Items = oG2antt.Items
	h = var_Items.AddItem("R1")
	var_Items.CellValue(h,1,"R2")
	var_Items.CellValue(var_Items.InsertItem(h,,"Cell 1.1"),1,"Cell 1.2")
	var_Items.CellValue(var_Items.InsertItem(h,,"Cell 2.1"),1,"Cell 2.2")
	var_Items.ExpandItem(h,true)
oG2antt.EndUpdate()
|
|
1076
|
How can I get the column from the cursor
/*begin event MouseMove(integer  Button, integer  Shift, long  X, long  Y) - Occurs when the user moves the mouse.*/
/*
	oG2antt = ole_1.Object
	MessageBox("Information",string( String(oG2antt.ColumnFromPoint(-1,-1)) ))
*/
/*end event MouseMove*/

OleObject oG2antt,var_Items
any h

oG2antt = ole_1.Object
oG2antt.BeginUpdate()
oG2antt.LinesAtRoot = -1
oG2antt.DrawGridLines = -1
oG2antt.Columns.Add("P1")
oG2antt.Columns.Add("P2")
var_Items = oG2antt.Items
	h = var_Items.AddItem("R1")
	var_Items.CellValue(h,1,"R2")
	var_Items.CellValue(var_Items.InsertItem(h,,"Cell 1.1"),1,"Cell 1.2")
	var_Items.CellValue(var_Items.InsertItem(h,,"Cell 2.1"),1,"Cell 2.2")
	var_Items.ExpandItem(h,true)
oG2antt.EndUpdate()
|
|
1075
|
How can I get the cell's caption from the cursor
/*begin event MouseMove(integer  Button, integer  Shift, long  X, long  Y) - Occurs when the user moves the mouse.*/
/*
	any h
	oG2antt = ole_1.Object
	h = oG2antt.ItemFromPoint(-1,-1,c,hit)
	MessageBox("Information",string( oG2antt.Items.CellCaption(h,c) ))
*/
/*end event MouseMove*/

OleObject oG2antt,var_Items
any h

oG2antt = ole_1.Object
oG2antt.BeginUpdate()
oG2antt.LinesAtRoot = -1
oG2antt.Columns.Add("Items")
var_Items = oG2antt.Items
	h = var_Items.AddItem("R1")
	var_Items.InsertItem(h,,"Cell 1.1")
	var_Items.InsertItem(h,,"Cell 1.2")
	var_Items.ExpandItem(h,true)
	h = var_Items.AddItem("R2")
	var_Items.InsertItem(h,,"Cell 2.1")
	var_Items.InsertItem(h,,"Cell 2.2")
	var_Items.ExpandItem(h,true)
oG2antt.EndUpdate()
|
|
1074
|
Is it possible to change the style for the vertical or horizontal grid lines, in the list area
OleObject oG2antt,var_Items
any h

oG2antt = ole_1.Object
oG2antt.BeginUpdate()
oG2antt.DrawGridLines = -1
oG2antt.GridLineStyle = 33 /*exGridLinesVSolid | exGridLinesHDot4*/
oG2antt.Columns.Add("C1")
oG2antt.Columns.Add("C2")
oG2antt.Columns.Add("C3")
var_Items = oG2antt.Items
	h = var_Items.AddItem("Item 1")
	var_Items.CellValue(h,1,"SubItem 1.2")
	var_Items.CellValue(h,2,"SubItem 1.3")
	h = var_Items.AddItem("Item 2")
	var_Items.CellValue(h,1,"SubItem 2.2")
	var_Items.CellValue(h,2,"SubItem 2.3")
oG2antt.EndUpdate()
|
|
1073
|
How can I show the bars over the grid lines, i.e. so you cannot see the grid lines 'through' the bar
OleObject oG2antt,var_Bar,var_Chart,var_Items,var_Level
any h

oG2antt = ole_1.Object
oG2antt.BeginUpdate()
oG2antt.DrawGridLines = -1
oG2antt.GridLineColor = RGB(220,220,220)
var_Chart = oG2antt.Chart
	var_Chart.PaneWidth(false,48)
	var_Chart.FirstVisibleDate = 2001-01-01
	var_Chart.DrawGridLines = -1
	var_Chart.GridLineStyle = 256
	var_Chart.LevelCount = 2
	var_Level = var_Chart.Level(1)
		var_Level.DrawGridLines = true
		var_Level.GridLineColor = RGB(220,220,220)
	var_Bar = var_Chart.Bars.Item("Task")
		var_Bar.Pattern = 1
		var_Bar.Height = 14
oG2antt.Columns.Add("Column")
var_Items = oG2antt.Items
	h = var_Items.AddItem("Item 1")
	var_Items.AddBar(h,"Task",2001-01-02,2001-01-05,"A")
	var_Items.AddBar(h,"Task",2001-01-08,2001-01-15,"B")
oG2antt.EndUpdate()
|
|
1072
|
Is it possible to change the style for the vertical grid lines, in the chart area only
OleObject oG2antt,var_Chart,var_Items,var_Level
any h

oG2antt = ole_1.Object
oG2antt.BeginUpdate()
oG2antt.DrawGridLines = -1
oG2antt.GridLineStyle = 12
var_Chart = oG2antt.Chart
	var_Chart.PaneWidth(false,48)
	var_Chart.FirstVisibleDate = 2001-01-01
	var_Chart.DrawGridLines = -1
	var_Chart.GridLineStyle = 12
	var_Chart.LevelCount = 2
	var_Chart.Level(1).DrawGridLines = true
	var_Level = var_Chart.Level(0)
		var_Level.GridLineColor = RGB(255,0,0)
		var_Level.GridLineStyle = 32
	var_Chart.Bars.Item("Task").Pattern = 1
oG2antt.Columns.Add("Column")
var_Items = oG2antt.Items
	h = var_Items.AddItem("Item 1")
	var_Items.AddBar(h,"Task",2001-01-02,2001-01-05,"A")
	var_Items.AddBar(h,"Task",2001-01-08,2001-01-15,"B")
oG2antt.EndUpdate()
|
|
1071
|
Is it possible to change the style for the grid lines, for instance to be solid not dotted
OleObject oG2antt,var_Chart,var_Items
any h

oG2antt = ole_1.Object
oG2antt.BeginUpdate()
oG2antt.DrawGridLines = -1
oG2antt.GridLineStyle = 48
var_Chart = oG2antt.Chart
	var_Chart.PaneWidth(false,48)
	var_Chart.FirstVisibleDate = 2001-01-01
	var_Chart.DrawGridLines = -1
	var_Chart.GridLineStyle = 48
	var_Chart.LevelCount = 2
	var_Chart.Level(1).DrawGridLines = true
	var_Chart.Bars.Item("Task").Pattern = 1
oG2antt.Columns.Add("Column")
var_Items = oG2antt.Items
	h = var_Items.AddItem("Item 1")
	var_Items.AddBar(h,"Task",2001-01-02,2001-01-05,"A")
	var_Items.AddBar(h,"Task",2001-01-08,2001-01-15,"B")
oG2antt.EndUpdate()
|
|
1070
|
How can I show the grid lines for the chart and list area
OleObject oG2antt,var_Chart,var_Items
any h

oG2antt = ole_1.Object
oG2antt.DrawGridLines = -1
var_Chart = oG2antt.Chart
	var_Chart.PaneWidth(false,48)
	var_Chart.FirstVisibleDate = 2001-01-01
	var_Chart.DrawGridLines = -1
	var_Chart.LevelCount = 2
	var_Chart.Level(1).DrawGridLines = true
	var_Chart.Bars.Item("Task").Pattern = 1
oG2antt.Columns.Add("Column")
var_Items = oG2antt.Items
	h = var_Items.AddItem("Item 1")
	var_Items.AddBar(h,"Task",2001-01-02,2001-01-05,"A")
	var_Items.AddBar(h,"Task",2001-01-08,2001-01-15,"B")
|
|
1069
|
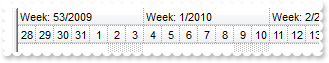
In the level of the chart we are showing the week number of the year (1-53) (Week: ww). However the weeknumber isn't correct. In western Europe the week of 04/01/2010 till 10/01/2010 is weeknumber 1, however the g2antt says it's week 2
OleObject oG2antt,var_Chart

oG2antt = ole_1.Object
var_Chart = oG2antt.Chart
	var_Chart.PaneWidth(false,0)
	var_Chart.FirstVisibleDate = 2009-12-28
	var_Chart.LevelCount = 2
	var_Chart.Level(0).Label = "Week: <%ww%>/<%yyyy%>"
	var_Chart.FirstWeekDay = 1
|
|
1068
|
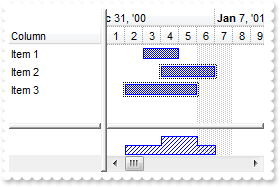
How can I determine the current visible date range of the gantt chart area
OleObject oG2antt,var_Chart,var_Items

oG2antt = ole_1.Object
oG2antt.Columns.Add("Task")
var_Chart = oG2antt.Chart
	var_Chart.FirstVisibleDate = 2001-01-01
	var_Chart.PaneWidth(false,48)
var_Items = oG2antt.Items
	var_Items.AddBar(var_Items.AddItem("Task 1"),"Task",2001-01-02,2001-01-06)
	var_Items.AddBar(var_Items.AddItem("Task 2"),"Task",2001-01-03,2001-01-07)
	var_Items.AddBar(var_Items.AddItem("Task 3"),"Task",2001-01-04,2001-01-08)
	var_Items.AddBar(var_Items.AddItem("Task 4"),"Task",2001-01-06,2001-01-10)
MessageBox("Information",string( String(oG2antt.Chart.StartPrintDate) ))
MessageBox("Information",string( String(oG2antt.Chart.EndPrintDate) ))
|
|
1067
|
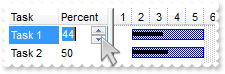
How can I change the progress bar using a spin editor using values from 0 to 100
OleObject oG2antt,var_Chart,var_Column,var_Columns,var_Items
any h

oG2antt = ole_1.Object
oG2antt.BeginUpdate()
oG2antt.Items.AllowCellValueToItemBar = true
var_Columns = oG2antt.Columns
	var_Columns.Add("Task")
	var_Column = var_Columns.Add("Percent")
		var_Column.Editor.EditType = 4
		var_Column.Def(18,518)
var_Chart = oG2antt.Chart
	var_Chart.FirstVisibleDate = 2001-01-01
	var_Chart.Bars.Add("Task%Progress")
var_Items = oG2antt.Items
	h = var_Items.AddItem("Task 1")
	var_Items.AddBar(h,"Task%Progress",2001-01-02,2001-01-06)
	var_Items.CellValue(h,1,40)
	h = var_Items.AddItem("Task 2")
	var_Items.AddBar(h,"Task%Progress",2001-01-02,2001-01-06)
	var_Items.CellValue(h,1,50)
oG2antt.EndUpdate()
|
|
1066
|
Is it possible to display the histogram for selected bars only
OleObject oG2antt,var_Chart,var_Items

oG2antt = ole_1.Object
oG2antt.BeginUpdate()
var_Chart = oG2antt.Chart
	var_Chart.LevelCount = 2
	var_Chart.PaneWidth(false,64)
	var_Chart.FirstVisibleDate = 2001-01-01
	var_Chart.HistogramVisible = true
	var_Chart.HistogramView = 8
	var_Chart.HistogramHeight = 32
	var_Chart.Bars.Item("Task").HistogramPattern = 6
oG2antt.Columns.Add("Column")
var_Items = oG2antt.Items
	var_Items.AddBar(var_Items.AddItem("Item 1"),"Task",2001-01-03,2001-01-05,1)
	var_Items.AddBar(var_Items.AddItem("Item 2"),"Task",2001-01-04,2001-01-07,2)
	var_Items.AddBar(var_Items.AddItem("Item 3"),"Task",2001-01-02,2001-01-06,3)
	var_Items.ItemBar(0,2,257,true)
	var_Items.ItemBar(0,3,257,true)
oG2antt.EndUpdate()
|
|
1065
|
How can I fix a bar, so it is not selectable, moveable or resizable, fixed in other words
OleObject oG2antt,var_Chart,var_Items
any h1

oG2antt = ole_1.Object
oG2antt.BeginUpdate()
oG2antt.Columns.Add("Task")
var_Chart = oG2antt.Chart
	var_Chart.FirstVisibleDate = 2001-01-01
	var_Chart.PaneWidth(false,48)
var_Items = oG2antt.Items
	h1 = var_Items.AddItem("Task 1")
	var_Items.AddBar(h1,"Task",2001-01-02,2001-01-08,"K1","Unselectable")
	var_Items.ItemBar(h1,"K1",29,false)
oG2antt.EndUpdate()
|
|
1064
|
How can I fix a bar, so it is not moveable or resizable
OleObject oG2antt,var_Chart,var_Items
any h1

oG2antt = ole_1.Object
oG2antt.BeginUpdate()
oG2antt.Columns.Add("Task")
var_Chart = oG2antt.Chart
	var_Chart.FirstVisibleDate = 2001-01-01
	var_Chart.PaneWidth(false,48)
var_Items = oG2antt.Items
	h1 = var_Items.AddItem("Task 1")
	var_Items.AddBar(h1,"Task",2001-01-02,2001-01-04,"K1","Fixed")
	var_Items.ItemBar(h1,"K1",10,false)
	var_Items.ItemBar(h1,"K1",11,false)
oG2antt.EndUpdate()
|
|
1063
|
Is is possible to fix a bar during PDM scheduling
OleObject oG2antt,var_Chart,var_Items
any h1,h2,h3

oG2antt = ole_1.Object
oG2antt.BeginUpdate()
oG2antt.Columns.Add("Task")
var_Chart = oG2antt.Chart
	var_Chart.FirstVisibleDate = 2001-01-01
	var_Chart.PaneWidth(false,48)
var_Items = oG2antt.Items
	h1 = var_Items.AddItem("Task 1")
	var_Items.AddBar(h1,"TaskF",2001-01-02,2001-01-04,"K1")
	var_Items.ItemBar(h1,"K1",10,false)
	var_Items.ItemBar(h1,"K1",11,false)
	h2 = var_Items.AddItem("Task 2")
	var_Items.AddBar(h2,"Task",2001-01-02,2001-01-04,"K2")
	var_Items.AddLink("L1",h1,"K1",h2,"K2")
	h3 = var_Items.AddItem("Task 3")
	var_Items.AddBar(h3,"TaskF",2001-01-02,2001-01-04,"K3")
	var_Items.ItemBar(h3,"K3",10,false)
	var_Items.ItemBar(h3,"K3",11,false)
	var_Items.AddLink("L2",h2,"K2",h3,"K3")
	var_Items.SchedulePDM(0,"K1")
oG2antt.EndUpdate()
|
|
1062
|
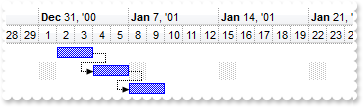
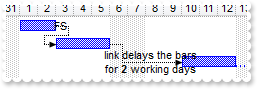
How can I specify that during scheduling the link, bars should be delayed, on working part
OleObject oG2antt,var_Chart,var_Items
any h1,h2,h3

oG2antt = ole_1.Object
oG2antt.BeginUpdate()
oG2antt.Columns.Add("Task")
var_Chart = oG2antt.Chart
	var_Chart.Bars.Add("Task:Split").Shortcut = "Task"
	var_Chart.FirstVisibleDate = 2001-01-01
	var_Chart.PaneWidth(false,48)
var_Items = oG2antt.Items
	h1 = var_Items.AddItem("Task 1")
	var_Items.AddBar(h1,"Task",2001-01-01,2001-01-03,"K1")
	var_Items.ItemBar(h1,"K1",20,true)
	h2 = var_Items.AddItem("Task 2")
	var_Items.AddBar(h2,"Task",2001-01-02,2001-01-05,"K2")
	var_Items.ItemBar(h2,"K2",20,true)
	var_Items.AddLink("L1",h1,"K1",h2,"K2")
	var_Items.Link("L1",12,"FS")
	h3 = var_Items.AddItem("Task 3")
	var_Items.AddBar(h3,"Task",2001-01-02,2001-01-06,"K3")
	var_Items.ItemBar(h3,"K3",20,true)
	var_Items.AddLink("L2",h2,"K2",h3,"K3")
	var_Items.Link("L2",12,"link delays the bars<br>for <b>2</b> working days")
	var_Items.Link("L2",16,2)
	var_Items.SchedulePDM(0,"K1")
oG2antt.EndUpdate()
|
|
1061
|
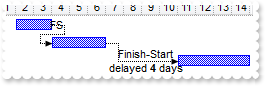
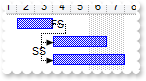
How can I specify that during scheduling the link, bars should be delayed
OleObject oG2antt,var_Chart,var_Items
any h1,h2,h3

oG2antt = ole_1.Object
oG2antt.BeginUpdate()
oG2antt.Columns.Add("Task")
var_Chart = oG2antt.Chart
	var_Chart.ShowNonworkingDates = false
	var_Chart.FirstVisibleDate = 2001-01-01
	var_Chart.PaneWidth(false,48)
var_Items = oG2antt.Items
	h1 = var_Items.AddItem("Task 1")
	var_Items.AddBar(h1,"Task",2001-01-02,2001-01-04,"K1")
	h2 = var_Items.AddItem("Task 2")
	var_Items.AddBar(h2,"Task",2001-01-02,2001-01-05,"K2")
	var_Items.AddLink("L1",h1,"K1",h2,"K2")
	var_Items.Link("L1",12,"FS")
	h3 = var_Items.AddItem("Task 3")
	var_Items.AddBar(h3,"Task",2001-01-02,2001-01-06,"K3")
	var_Items.AddLink("L2",h2,"K2",h3,"K3")
	var_Items.Link("L2",12,"   Finish-Start<br>delayed <b>4</b> days")
	var_Items.Link("L2",17,4)
	var_Items.SchedulePDM(0,"K1")
oG2antt.EndUpdate()
|
|
1060
|
The SchedulePDM method put the bars on non-working part, how can I prevent that
OleObject oG2antt,var_Chart,var_Items
any h1,h2,h3

oG2antt = ole_1.Object
oG2antt.BeginUpdate()
oG2antt.Columns.Add("Task")
var_Chart = oG2antt.Chart
	var_Chart.Bars.Add("Task:Split").Shortcut = "Task"
	var_Chart.FirstVisibleDate = 2001-01-01
	var_Chart.PaneWidth(false,48)
var_Items = oG2antt.Items
	h1 = var_Items.AddItem("Task 1")
	var_Items.AddBar(h1,"Task",2001-01-02,2001-01-04,"K1")
	var_Items.ItemBar(h1,"K1",20,true)
	h2 = var_Items.AddItem("Task 2")
	var_Items.AddBar(h2,"Task",2001-01-02,2001-01-05,"K2")
	var_Items.ItemBar(h2,"K2",20,true)
	var_Items.AddLink("L1",h1,"K1",h2,"K2")
	var_Items.Link("L1",12,"FS")
	h3 = var_Items.AddItem("Task 3")
	var_Items.AddBar(h3,"Task",2001-01-02,2001-01-06,"K3")
	var_Items.ItemBar(h3,"K3",20,true)
	var_Items.AddLink("L2",h2,"K2",h3,"K3")
	var_Items.Link("L2",12,"FS")
	var_Items.SchedulePDM(0,"K1")
oG2antt.EndUpdate()
|
|
1059
|
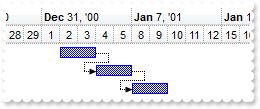
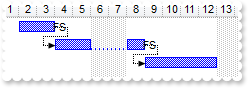
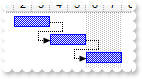
How can I add a SF (Start-Finish) link so activities get arranged using the SchedulePDM
OleObject oG2antt,var_Chart,var_Items
any h1,h2,h3

oG2antt = ole_1.Object
oG2antt.BeginUpdate()
oG2antt.Columns.Add("Task")
var_Chart = oG2antt.Chart
	var_Chart.FirstVisibleDate = 2000-12-28
	var_Chart.PaneWidth(false,48)
var_Items = oG2antt.Items
	h1 = var_Items.AddItem("Task 1")
	var_Items.AddBar(h1,"Task",2001-01-02,2001-01-04,"K1")
	h2 = var_Items.AddItem("Task 2")
	var_Items.AddBar(h2,"Task",2001-01-02,2001-01-05,"K2")
	var_Items.AddLink("L1",h1,"K1",h2,"K2")
	var_Items.Link("L1",12,"FS")
	h3 = var_Items.AddItem("Task 3")
	var_Items.AddBar(h3,"Task",2001-01-02,2001-01-06,"K3")
	var_Items.AddLink("L2",h2,"K2",h3,"K3")
	var_Items.Link("L2",12,"SF")
	var_Items.Link("L2",6,0)
	var_Items.Link("L2",7,2)
	var_Items.SchedulePDM(0,"K1")
oG2antt.EndUpdate()
|
|
1058
|
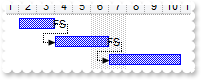
How can I add a SS (Start-Start) link so activities get arranged using the SchedulePDM
OleObject oG2antt,var_Chart,var_Items
any h1,h2,h3

oG2antt = ole_1.Object
oG2antt.BeginUpdate()
oG2antt.Columns.Add("Task")
var_Chart = oG2antt.Chart
	var_Chart.FirstVisibleDate = 2000-12-28
	var_Chart.PaneWidth(false,48)
var_Items = oG2antt.Items
	h1 = var_Items.AddItem("Task 1")
	var_Items.AddBar(h1,"Task",2001-01-02,2001-01-04,"K1")
	h2 = var_Items.AddItem("Task 2")
	var_Items.AddBar(h2,"Task",2001-01-02,2001-01-05,"K2")
	var_Items.AddLink("L1",h1,"K1",h2,"K2")
	var_Items.Link("L1",12,"FS")
	h3 = var_Items.AddItem("Task 3")
	var_Items.AddBar(h3,"Task",2001-01-02,2001-01-06,"K3")
	var_Items.AddLink("L2",h2,"K2",h3,"K3")
	var_Items.Link("L2",12,"SS")
	var_Items.Link("L2",6,0)
	var_Items.Link("L2",7,0)
	var_Items.SchedulePDM(0,"K1")
oG2antt.EndUpdate()
|
|
1057
|
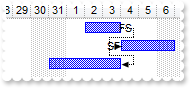
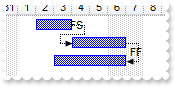
How can I add a FF (Finish-Finish) link so activities get arranged using the SchedulePDM
OleObject oG2antt,var_Chart,var_Items
any h1,h2,h3

oG2antt = ole_1.Object
oG2antt.BeginUpdate()
oG2antt.Columns.Add("Task")
var_Chart = oG2antt.Chart
	var_Chart.FirstVisibleDate = 2000-12-28
	var_Chart.PaneWidth(false,48)
var_Items = oG2antt.Items
	h1 = var_Items.AddItem("Task 1")
	var_Items.AddBar(h1,"Task",2001-01-02,2001-01-04,"K1")
	h2 = var_Items.AddItem("Task 2")
	var_Items.AddBar(h2,"Task",2001-01-02,2001-01-05,"K2")
	var_Items.AddLink("L1",h1,"K1",h2,"K2")
	var_Items.Link("L1",12,"FS")
	h3 = var_Items.AddItem("Task 3")
	var_Items.AddBar(h3,"Task",2001-01-02,2001-01-06,"K3")
	var_Items.AddLink("L2",h2,"K2",h3,"K3")
	var_Items.Link("L2",12,"FF")
	var_Items.Link("L2",6,2)
	var_Items.Link("L2",7,2)
	var_Items.SchedulePDM(0,"K1")
oG2antt.EndUpdate()
|
|
1056
|
How can I add a FS (Finish-Start) link so activities get arranged using the SchedulePDM
OleObject oG2antt,var_Chart,var_Items
any h1,h2,h3

oG2antt = ole_1.Object
oG2antt.BeginUpdate()
oG2antt.Columns.Add("Task")
var_Chart = oG2antt.Chart
	var_Chart.FirstVisibleDate = 2001-01-01
	var_Chart.PaneWidth(false,48)
var_Items = oG2antt.Items
	h1 = var_Items.AddItem("Task 1")
	var_Items.AddBar(h1,"Task",2001-01-02,2001-01-04,"K1")
	h2 = var_Items.AddItem("Task 2")
	var_Items.AddBar(h2,"Task",2001-01-02,2001-01-05,"K2")
	var_Items.AddLink("L1",h1,"K1",h2,"K2")
	var_Items.Link("L1",12,"FS")
	h3 = var_Items.AddItem("Task 3")
	var_Items.AddBar(h3,"Task",2001-01-02,2001-01-06,"K3")
	var_Items.AddLink("L2",h2,"K2",h3,"K3")
	var_Items.Link("L2",12,"FS")
	var_Items.SchedulePDM(0,"K1")
oG2antt.EndUpdate()
|
|
1055
|
How can I schedule activities in the project plan
OleObject oG2antt,var_Chart,var_Items
any h1,h2,h3

oG2antt = ole_1.Object
oG2antt.BeginUpdate()
oG2antt.Columns.Add("Task")
var_Chart = oG2antt.Chart
	var_Chart.FirstVisibleDate = 2001-01-01
	var_Chart.PaneWidth(false,48)
var_Items = oG2antt.Items
	h1 = var_Items.AddItem("Task 1")
	var_Items.AddBar(h1,"Task",2001-01-02,2001-01-04,"K1")
	h2 = var_Items.AddItem("Task 2")
	var_Items.AddBar(h2,"Task",2001-01-02,2001-01-04,"K2")
	var_Items.AddLink("L1",h1,"K1",h2,"K2")
	h3 = var_Items.AddItem("Task 3")
	var_Items.AddBar(h3,"Task",2001-01-02,2001-01-04,"K3")
	var_Items.AddLink("L2",h3,"K3",h2,"K2")
	var_Items.SchedulePDM(0,"K1")
oG2antt.EndUpdate()
|
|
1054
|
How do I arrange the bars based on the links
OleObject oG2antt,var_Chart,var_Items
any h1,h2,h3

oG2antt = ole_1.Object
oG2antt.BeginUpdate()
oG2antt.Columns.Add("Task")
var_Chart = oG2antt.Chart
	var_Chart.FirstVisibleDate = 2001-01-01
	var_Chart.PaneWidth(false,48)
var_Items = oG2antt.Items
	h1 = var_Items.AddItem("Task 1")
	var_Items.AddBar(h1,"Task",2001-01-02,2001-01-04,"K1")
	h2 = var_Items.AddItem("Task 2")
	var_Items.AddBar(h2,"Task",2001-01-02,2001-01-04,"K2")
	var_Items.AddLink("L1",h1,"K1",h2,"K2")
	h3 = var_Items.AddItem("Task 3")
	var_Items.AddBar(h3,"Task",2001-01-02,2001-01-04,"K3")
	var_Items.AddLink("L2",h2,"K2",h3,"K3")
	var_Items.SchedulePDM(0,"K1")
oG2antt.EndUpdate()
|
|
1053
|
Is is possible to use HTML tags to display in the filter caption
OleObject oG2antt,var_Items

oG2antt = ole_1.Object
oG2antt.BeginUpdate()
oG2antt.FilterBarPromptVisible = true
oG2antt.FilterBarCaption = "This is a bit of text being displayed in the filter bar."
oG2antt.Columns.Add("")
var_Items = oG2antt.Items
	var_Items.AddItem("Item 1")
	var_Items.AddItem("Item 2")
	var_Items.AddItem("Item 3")
oG2antt.EndUpdate()
|
|
1052
|
How can I find the number of items after filtering
OleObject oG2antt,var_Items
any h

oG2antt = ole_1.Object
oG2antt.BeginUpdate()
oG2antt.Columns.Add("")
var_Items = oG2antt.Items
	h = var_Items.AddItem("")
	var_Items.CellValue(h,0,var_Items.VisibleItemCount)
oG2antt.EndUpdate()
|
|
1051
|
How can I change the filter caption
OleObject oG2antt,var_Columns,var_Items
any h0

oG2antt = ole_1.Object
oG2antt.BeginUpdate()
oG2antt.Chart.PaneWidth(true,0)
oG2antt.ColumnAutoResize = true
oG2antt.ContinueColumnScroll = false
oG2antt.FocusColumnIndex = 1
oG2antt.MarkSearchColumn = false
oG2antt.SearchColumnIndex = 1
oG2antt.FilterBarPromptVisible = true
oG2antt.FilterBarPromptType = 12801 /*exFilterPromptWords | exFilterPromptContainsAll*/
oG2antt.FilterBarPromptPattern = "london robert"
oG2antt.FilterBarCaption = "<r>Found: ... "
var_Columns = oG2antt.Columns
	var_Columns.Add("Name").Width = 96
	var_Columns.Add("Title").Width = 96
	var_Columns.Add("City")
var_Items = oG2antt.Items
	h0 = var_Items.AddItem("Nancy Davolio")
	var_Items.CellValue(h0,1,"Sales Representative")
	var_Items.CellValue(h0,2,"Seattle")
	h0 = var_Items.AddItem("Andrew Fuller")
	var_Items.CellValue(h0,1,"Vice President, Sales")
	var_Items.CellValue(h0,2,"Tacoma")
	var_Items.SelectItem(h0,true)
	h0 = var_Items.AddItem("Janet Leverling")
	var_Items.CellValue(h0,1,"Sales Representative")
	var_Items.CellValue(h0,2,"Kirkland")
	h0 = var_Items.AddItem("Margaret Peacock")
	var_Items.CellValue(h0,1,"Sales Representative")
	var_Items.CellValue(h0,2,"Redmond")
	h0 = var_Items.AddItem("Steven Buchanan")
	var_Items.CellValue(h0,1,"Sales Manager")
	var_Items.CellValue(h0,2,"London")
	h0 = var_Items.AddItem("Michael Suyama")
	var_Items.CellValue(h0,1,"Sales Representative")
	var_Items.CellValue(h0,2,"London")
	h0 = var_Items.AddItem("Robert King")
	var_Items.CellValue(h0,1,"Sales Representative")
	var_Items.CellValue(h0,2,"London")
	h0 = var_Items.AddItem("Laura Callahan")
	var_Items.CellValue(h0,1,"Inside Sales Coordinator")
	var_Items.CellValue(h0,2,"Seattle")
	h0 = var_Items.AddItem("Anne Dodsworth")
	var_Items.CellValue(h0,1,"Sales Representative")
	var_Items.CellValue(h0,2,"London")
oG2antt.EndUpdate()
|
|
1050
|
While using the filter prompt is it is possible to use wild characters
OleObject oG2antt,var_Columns,var_Items
any h0

oG2antt = ole_1.Object
oG2antt.BeginUpdate()
oG2antt.Chart.PaneWidth(true,0)
oG2antt.ColumnAutoResize = true
oG2antt.ContinueColumnScroll = false
oG2antt.FocusColumnIndex = 1
oG2antt.MarkSearchColumn = false
oG2antt.SearchColumnIndex = 1
oG2antt.FilterBarPromptVisible = true
oG2antt.FilterBarPromptType = 16
oG2antt.FilterBarPromptPattern = "lon* seat*"
var_Columns = oG2antt.Columns
	var_Columns.Add("Name").Width = 96
	var_Columns.Add("Title").Width = 96
	var_Columns.Add("City")
var_Items = oG2antt.Items
	h0 = var_Items.AddItem("Nancy Davolio")
	var_Items.CellValue(h0,1,"Sales Representative")
	var_Items.CellValue(h0,2,"Seattle")
	h0 = var_Items.AddItem("Andrew Fuller")
	var_Items.CellValue(h0,1,"Vice President, Sales")
	var_Items.CellValue(h0,2,"Tacoma")
	var_Items.SelectItem(h0,true)
	h0 = var_Items.AddItem("Janet Leverling")
	var_Items.CellValue(h0,1,"Sales Representative")
	var_Items.CellValue(h0,2,"Kirkland")
	h0 = var_Items.AddItem("Margaret Peacock")
	var_Items.CellValue(h0,1,"Sales Representative")
	var_Items.CellValue(h0,2,"Redmond")
	h0 = var_Items.AddItem("Steven Buchanan")
	var_Items.CellValue(h0,1,"Sales Manager")
	var_Items.CellValue(h0,2,"London")
	h0 = var_Items.AddItem("Michael Suyama")
	var_Items.CellValue(h0,1,"Sales Representative")
	var_Items.CellValue(h0,2,"London")
	h0 = var_Items.AddItem("Robert King")
	var_Items.CellValue(h0,1,"Sales Representative")
	var_Items.CellValue(h0,2,"London")
	h0 = var_Items.AddItem("Laura Callahan")
	var_Items.CellValue(h0,1,"Inside Sales Coordinator")
	var_Items.CellValue(h0,2,"Seattle")
	h0 = var_Items.AddItem("Anne Dodsworth")
	var_Items.CellValue(h0,1,"Sales Representative")
	var_Items.CellValue(h0,2,"London")
oG2antt.EndUpdate()
|
|
1049
|
How can I list all items that contains any of specified words, not necessary at the beggining
OleObject oG2antt,var_Columns,var_Items
any h0

oG2antt = ole_1.Object
oG2antt.BeginUpdate()
oG2antt.Chart.PaneWidth(true,0)
oG2antt.ColumnAutoResize = true
oG2antt.ContinueColumnScroll = false
oG2antt.FocusColumnIndex = 1
oG2antt.MarkSearchColumn = false
oG2antt.SearchColumnIndex = 1
oG2antt.FilterBarPromptVisible = true
oG2antt.FilterBarPromptType = 4610 /*exFilterPromptStartWords | exFilterPromptContainsAny*/
oG2antt.FilterBarPromptPattern = "london davolio"
var_Columns = oG2antt.Columns
	var_Columns.Add("Name").Width = 96
	var_Columns.Add("Title").Width = 96
	var_Columns.Add("City")
var_Items = oG2antt.Items
	h0 = var_Items.AddItem("Nancy Davolio")
	var_Items.CellValue(h0,1,"Sales Representative")
	var_Items.CellValue(h0,2,"Seattle")
	h0 = var_Items.AddItem("Andrew Fuller")
	var_Items.CellValue(h0,1,"Vice President, Sales")
	var_Items.CellValue(h0,2,"Tacoma")
	var_Items.SelectItem(h0,true)
	h0 = var_Items.AddItem("Janet Leverling")
	var_Items.CellValue(h0,1,"Sales Representative")
	var_Items.CellValue(h0,2,"Kirkland")
	h0 = var_Items.AddItem("Margaret Peacock")
	var_Items.CellValue(h0,1,"Sales Representative")
	var_Items.CellValue(h0,2,"Redmond")
	h0 = var_Items.AddItem("Steven Buchanan")
	var_Items.CellValue(h0,1,"Sales Manager")
	var_Items.CellValue(h0,2,"London")
	h0 = var_Items.AddItem("Michael Suyama")
	var_Items.CellValue(h0,1,"Sales Representative")
	var_Items.CellValue(h0,2,"London")
	h0 = var_Items.AddItem("Robert King")
	var_Items.CellValue(h0,1,"Sales Representative")
	var_Items.CellValue(h0,2,"London")
	h0 = var_Items.AddItem("Laura Callahan")
	var_Items.CellValue(h0,1,"Inside Sales Coordinator")
	var_Items.CellValue(h0,2,"Seattle")
	h0 = var_Items.AddItem("Anne Dodsworth")
	var_Items.CellValue(h0,1,"Sales Representative")
	var_Items.CellValue(h0,2,"London")
oG2antt.EndUpdate()
|
|
1048
|
How can I list all items that contains any of specified words, not strings
OleObject oG2antt,var_Columns,var_Items
any h0

oG2antt = ole_1.Object
oG2antt.BeginUpdate()
oG2antt.ColumnAutoResize = true
oG2antt.ContinueColumnScroll = false
oG2antt.FocusColumnIndex = 1
oG2antt.Chart.PaneWidth(true,0)
oG2antt.MarkSearchColumn = false
oG2antt.SearchColumnIndex = 1
oG2antt.FilterBarPromptVisible = true
oG2antt.FilterBarPromptType = 12802 /*exFilterPromptWords | exFilterPromptContainsAny*/
oG2antt.FilterBarPromptPattern = "london nancy"
var_Columns = oG2antt.Columns
	var_Columns.Add("Name").Width = 96
	var_Columns.Add("Title").Width = 96
	var_Columns.Add("City")
var_Items = oG2antt.Items
	h0 = var_Items.AddItem("Nancy Davolio")
	var_Items.CellValue(h0,1,"Sales Representative")
	var_Items.CellValue(h0,2,"Seattle")
	h0 = var_Items.AddItem("Andrew Fuller")
	var_Items.CellValue(h0,1,"Vice President, Sales")
	var_Items.CellValue(h0,2,"Tacoma")
	var_Items.SelectItem(h0,true)
	h0 = var_Items.AddItem("Janet Leverling")
	var_Items.CellValue(h0,1,"Sales Representative")
	var_Items.CellValue(h0,2,"Kirkland")
	h0 = var_Items.AddItem("Margaret Peacock")
	var_Items.CellValue(h0,1,"Sales Representative")
	var_Items.CellValue(h0,2,"Redmond")
	h0 = var_Items.AddItem("Steven Buchanan")
	var_Items.CellValue(h0,1,"Sales Manager")
	var_Items.CellValue(h0,2,"London")
	h0 = var_Items.AddItem("Michael Suyama")
	var_Items.CellValue(h0,1,"Sales Representative")
	var_Items.CellValue(h0,2,"London")
	h0 = var_Items.AddItem("Robert King")
	var_Items.CellValue(h0,1,"Sales Representative")
	var_Items.CellValue(h0,2,"London")
	h0 = var_Items.AddItem("Laura Callahan")
	var_Items.CellValue(h0,1,"Inside Sales Coordinator")
	var_Items.CellValue(h0,2,"Seattle")
	h0 = var_Items.AddItem("Anne Dodsworth")
	var_Items.CellValue(h0,1,"Sales Representative")
	var_Items.CellValue(h0,2,"London")
oG2antt.EndUpdate()
|
|
1047
|
How can I list all items that contains all specified words, not strings
OleObject oG2antt,var_Columns,var_Items
any h0

oG2antt = ole_1.Object
oG2antt.BeginUpdate()
oG2antt.Chart.PaneWidth(true,0)
oG2antt.ColumnAutoResize = true
oG2antt.ContinueColumnScroll = false
oG2antt.FocusColumnIndex = 1
oG2antt.MarkSearchColumn = false
oG2antt.SearchColumnIndex = 1
oG2antt.FilterBarPromptVisible = true
oG2antt.FilterBarPromptType = 12801 /*exFilterPromptWords | exFilterPromptContainsAll*/
oG2antt.FilterBarPromptPattern = "london robert"
var_Columns = oG2antt.Columns
	var_Columns.Add("Name").Width = 96
	var_Columns.Add("Title").Width = 96
	var_Columns.Add("City")
var_Items = oG2antt.Items
	h0 = var_Items.AddItem("Nancy Davolio")
	var_Items.CellValue(h0,1,"Sales Representative")
	var_Items.CellValue(h0,2,"Seattle")
	h0 = var_Items.AddItem("Andrew Fuller")
	var_Items.CellValue(h0,1,"Vice President, Sales")
	var_Items.CellValue(h0,2,"Tacoma")
	var_Items.SelectItem(h0,true)
	h0 = var_Items.AddItem("Janet Leverling")
	var_Items.CellValue(h0,1,"Sales Representative")
	var_Items.CellValue(h0,2,"Kirkland")
	h0 = var_Items.AddItem("Margaret Peacock")
	var_Items.CellValue(h0,1,"Sales Representative")
	var_Items.CellValue(h0,2,"Redmond")
	h0 = var_Items.AddItem("Steven Buchanan")
	var_Items.CellValue(h0,1,"Sales Manager")
	var_Items.CellValue(h0,2,"London")
	h0 = var_Items.AddItem("Michael Suyama")
	var_Items.CellValue(h0,1,"Sales Representative")
	var_Items.CellValue(h0,2,"London")
	h0 = var_Items.AddItem("Robert King")
	var_Items.CellValue(h0,1,"Sales Representative")
	var_Items.CellValue(h0,2,"London")
	h0 = var_Items.AddItem("Laura Callahan")
	var_Items.CellValue(h0,1,"Inside Sales Coordinator")
	var_Items.CellValue(h0,2,"Seattle")
	h0 = var_Items.AddItem("Anne Dodsworth")
	var_Items.CellValue(h0,1,"Sales Representative")
	var_Items.CellValue(h0,2,"London")
oG2antt.EndUpdate()
|
|
1046
|
I've noticed that the filtering by prompt is not case sensitive, is is possible to make it case sensitive
OleObject oG2antt,var_Columns,var_Items
any h0

oG2antt = ole_1.Object
oG2antt.BeginUpdate()
oG2antt.ColumnAutoResize = true
oG2antt.ContinueColumnScroll = false
oG2antt.FocusColumnIndex = 1
oG2antt.MarkSearchColumn = false
oG2antt.SearchColumnIndex = 1
oG2antt.FilterBarPromptVisible = true
oG2antt.FilterBarPromptType = 258 /*exFilterPromptCaseSensitive | exFilterPromptContainsAny*/
oG2antt.FilterBarPromptPattern = "Anne"
oG2antt.Chart.PaneWidth(true,0)
var_Columns = oG2antt.Columns
	var_Columns.Add("Name").Width = 96
	var_Columns.Add("Title").Width = 96
	var_Columns.Add("City")
var_Items = oG2antt.Items
	h0 = var_Items.AddItem("Nancy Davolio")
	var_Items.CellValue(h0,1,"Sales Representative")
	var_Items.CellValue(h0,2,"Seattle")
	h0 = var_Items.AddItem("Andrew Fuller")
	var_Items.CellValue(h0,1,"Vice President, Sales")
	var_Items.CellValue(h0,2,"Tacoma")
	var_Items.SelectItem(h0,true)
	h0 = var_Items.AddItem("Janet Leverling")
	var_Items.CellValue(h0,1,"Sales Representative")
	var_Items.CellValue(h0,2,"Kirkland")
	h0 = var_Items.AddItem("Margaret Peacock")
	var_Items.CellValue(h0,1,"Sales Representative")
	var_Items.CellValue(h0,2,"Redmond")
	h0 = var_Items.AddItem("Steven Buchanan")
	var_Items.CellValue(h0,1,"Sales Manager")
	var_Items.CellValue(h0,2,"London")
	h0 = var_Items.AddItem("Michael Suyama")
	var_Items.CellValue(h0,1,"Sales Representative")
	var_Items.CellValue(h0,2,"London")
	h0 = var_Items.AddItem("Robert King")
	var_Items.CellValue(h0,1,"Sales Representative")
	var_Items.CellValue(h0,2,"London")
	h0 = var_Items.AddItem("Laura Callahan")
	var_Items.CellValue(h0,1,"Inside Sales Coordinator")
	var_Items.CellValue(h0,2,"Seattle")
	h0 = var_Items.AddItem("Anne Dodsworth")
	var_Items.CellValue(h0,1,"Sales Representative")
	var_Items.CellValue(h0,2,"London")
oG2antt.EndUpdate()
|
|
1045
|
Is it possible to list only items that ends with any of specified strings
OleObject oG2antt,var_Columns,var_Items
any h0

oG2antt = ole_1.Object
oG2antt.BeginUpdate()
oG2antt.ColumnAutoResize = true
oG2antt.ContinueColumnScroll = false
oG2antt.FocusColumnIndex = 1
oG2antt.MarkSearchColumn = false
oG2antt.SearchColumnIndex = 1
oG2antt.FilterBarPromptVisible = true
oG2antt.FilterBarPromptType = 4
oG2antt.FilterBarPromptColumns = "0"
oG2antt.FilterBarPromptPattern = "Fuller"
oG2antt.Chart.PaneWidth(true,0)
var_Columns = oG2antt.Columns
	var_Columns.Add("Name").Width = 96
	var_Columns.Add("Title").Width = 96
	var_Columns.Add("City")
var_Items = oG2antt.Items
	h0 = var_Items.AddItem("Nancy Davolio")
	var_Items.CellValue(h0,1,"Sales Representative")
	var_Items.CellValue(h0,2,"Seattle")
	h0 = var_Items.AddItem("Andrew Fuller")
	var_Items.CellValue(h0,1,"Vice President, Sales")
	var_Items.CellValue(h0,2,"Tacoma")
	var_Items.SelectItem(h0,true)
	h0 = var_Items.AddItem("Janet Leverling")
	var_Items.CellValue(h0,1,"Sales Representative")
	var_Items.CellValue(h0,2,"Kirkland")
	h0 = var_Items.AddItem("Margaret Peacock")
	var_Items.CellValue(h0,1,"Sales Representative")
	var_Items.CellValue(h0,2,"Redmond")
	h0 = var_Items.AddItem("Steven Buchanan")
	var_Items.CellValue(h0,1,"Sales Manager")
	var_Items.CellValue(h0,2,"London")
	h0 = var_Items.AddItem("Michael Suyama")
	var_Items.CellValue(h0,1,"Sales Representative")
	var_Items.CellValue(h0,2,"London")
	h0 = var_Items.AddItem("Robert King")
	var_Items.CellValue(h0,1,"Sales Representative")
	var_Items.CellValue(h0,2,"London")
	h0 = var_Items.AddItem("Laura Callahan")
	var_Items.CellValue(h0,1,"Inside Sales Coordinator")
	var_Items.CellValue(h0,2,"Seattle")
	h0 = var_Items.AddItem("Anne Dodsworth")
	var_Items.CellValue(h0,1,"Sales Representative")
	var_Items.CellValue(h0,2,"London")
oG2antt.EndUpdate()
|
|
1044
|
Is it possible to list only items that ends with any of specified strings
OleObject oG2antt,var_Columns,var_Items
any h0

oG2antt = ole_1.Object
oG2antt.BeginUpdate()
oG2antt.ColumnAutoResize = true
oG2antt.ContinueColumnScroll = false
oG2antt.FocusColumnIndex = 1
oG2antt.MarkSearchColumn = false
oG2antt.SearchColumnIndex = 1
oG2antt.FilterBarPromptVisible = true
oG2antt.FilterBarPromptType = 4
oG2antt.FilterBarPromptColumns = "0"
oG2antt.FilterBarPromptPattern = "Fuller"
oG2antt.Chart.PaneWidth(true,0)
var_Columns = oG2antt.Columns
	var_Columns.Add("Name").Width = 96
	var_Columns.Add("Title").Width = 96
	var_Columns.Add("City")
var_Items = oG2antt.Items
	h0 = var_Items.AddItem("Nancy Davolio")
	var_Items.CellValue(h0,1,"Sales Representative")
	var_Items.CellValue(h0,2,"Seattle")
	h0 = var_Items.AddItem("Andrew Fuller")
	var_Items.CellValue(h0,1,"Vice President, Sales")
	var_Items.CellValue(h0,2,"Tacoma")
	var_Items.SelectItem(h0,true)
	h0 = var_Items.AddItem("Janet Leverling")
	var_Items.CellValue(h0,1,"Sales Representative")
	var_Items.CellValue(h0,2,"Kirkland")
	h0 = var_Items.AddItem("Margaret Peacock")
	var_Items.CellValue(h0,1,"Sales Representative")
	var_Items.CellValue(h0,2,"Redmond")
	h0 = var_Items.AddItem("Steven Buchanan")
	var_Items.CellValue(h0,1,"Sales Manager")
	var_Items.CellValue(h0,2,"London")
	h0 = var_Items.AddItem("Michael Suyama")
	var_Items.CellValue(h0,1,"Sales Representative")
	var_Items.CellValue(h0,2,"London")
	h0 = var_Items.AddItem("Robert King")
	var_Items.CellValue(h0,1,"Sales Representative")
	var_Items.CellValue(h0,2,"London")
	h0 = var_Items.AddItem("Laura Callahan")
	var_Items.CellValue(h0,1,"Inside Sales Coordinator")
	var_Items.CellValue(h0,2,"Seattle")
	h0 = var_Items.AddItem("Anne Dodsworth")
	var_Items.CellValue(h0,1,"Sales Representative")
	var_Items.CellValue(h0,2,"London")
oG2antt.EndUpdate()
|
|
1043
|
Is it possible to list only items that starts with any of specified strings
OleObject oG2antt,var_Columns,var_Items
any h0

oG2antt = ole_1.Object
oG2antt.BeginUpdate()
oG2antt.ColumnAutoResize = true
oG2antt.ContinueColumnScroll = false
oG2antt.FocusColumnIndex = 1
oG2antt.MarkSearchColumn = false
oG2antt.SearchColumnIndex = 1
oG2antt.FilterBarPromptVisible = true
oG2antt.FilterBarPromptType = 3
oG2antt.FilterBarPromptColumns = "0"
oG2antt.FilterBarPromptPattern = "An M"
oG2antt.Chart.PaneWidth(true,0)
var_Columns = oG2antt.Columns
	var_Columns.Add("Name").Width = 96
	var_Columns.Add("Title").Width = 96
	var_Columns.Add("City")
var_Items = oG2antt.Items
	h0 = var_Items.AddItem("Nancy Davolio")
	var_Items.CellValue(h0,1,"Sales Representative")
	var_Items.CellValue(h0,2,"Seattle")
	h0 = var_Items.AddItem("Andrew Fuller")
	var_Items.CellValue(h0,1,"Vice President, Sales")
	var_Items.CellValue(h0,2,"Tacoma")
	var_Items.SelectItem(h0,true)
	h0 = var_Items.AddItem("Janet Leverling")
	var_Items.CellValue(h0,1,"Sales Representative")
	var_Items.CellValue(h0,2,"Kirkland")
	h0 = var_Items.AddItem("Margaret Peacock")
	var_Items.CellValue(h0,1,"Sales Representative")
	var_Items.CellValue(h0,2,"Redmond")
	h0 = var_Items.AddItem("Steven Buchanan")
	var_Items.CellValue(h0,1,"Sales Manager")
	var_Items.CellValue(h0,2,"London")
	h0 = var_Items.AddItem("Michael Suyama")
	var_Items.CellValue(h0,1,"Sales Representative")
	var_Items.CellValue(h0,2,"London")
	h0 = var_Items.AddItem("Robert King")
	var_Items.CellValue(h0,1,"Sales Representative")
	var_Items.CellValue(h0,2,"London")
	h0 = var_Items.AddItem("Laura Callahan")
	var_Items.CellValue(h0,1,"Inside Sales Coordinator")
	var_Items.CellValue(h0,2,"Seattle")
	h0 = var_Items.AddItem("Anne Dodsworth")
	var_Items.CellValue(h0,1,"Sales Representative")
	var_Items.CellValue(h0,2,"London")
oG2antt.EndUpdate()
|
|
1042
|
Is it possible to list only items that starts with specified string
OleObject oG2antt,var_Columns,var_Items
any h0

oG2antt = ole_1.Object
oG2antt.BeginUpdate()
oG2antt.ColumnAutoResize = true
oG2antt.ContinueColumnScroll = false
oG2antt.FocusColumnIndex = 1
oG2antt.MarkSearchColumn = false
oG2antt.SearchColumnIndex = 1
oG2antt.FilterBarPromptVisible = true
oG2antt.FilterBarPromptType = 3
oG2antt.FilterBarPromptColumns = "0"
oG2antt.FilterBarPromptPattern = "A"
oG2antt.Chart.PaneWidth(true,0)
var_Columns = oG2antt.Columns
	var_Columns.Add("Name").Width = 96
	var_Columns.Add("Title").Width = 96
	var_Columns.Add("City")
var_Items = oG2antt.Items
	h0 = var_Items.AddItem("Nancy Davolio")
	var_Items.CellValue(h0,1,"Sales Representative")
	var_Items.CellValue(h0,2,"Seattle")
	h0 = var_Items.AddItem("Andrew Fuller")
	var_Items.CellValue(h0,1,"Vice President, Sales")
	var_Items.CellValue(h0,2,"Tacoma")
	var_Items.SelectItem(h0,true)
	h0 = var_Items.AddItem("Janet Leverling")
	var_Items.CellValue(h0,1,"Sales Representative")
	var_Items.CellValue(h0,2,"Kirkland")
	h0 = var_Items.AddItem("Margaret Peacock")
	var_Items.CellValue(h0,1,"Sales Representative")
	var_Items.CellValue(h0,2,"Redmond")
	h0 = var_Items.AddItem("Steven Buchanan")
	var_Items.CellValue(h0,1,"Sales Manager")
	var_Items.CellValue(h0,2,"London")
	h0 = var_Items.AddItem("Michael Suyama")
	var_Items.CellValue(h0,1,"Sales Representative")
	var_Items.CellValue(h0,2,"London")
	h0 = var_Items.AddItem("Robert King")
	var_Items.CellValue(h0,1,"Sales Representative")
	var_Items.CellValue(h0,2,"London")
	h0 = var_Items.AddItem("Laura Callahan")
	var_Items.CellValue(h0,1,"Inside Sales Coordinator")
	var_Items.CellValue(h0,2,"Seattle")
	h0 = var_Items.AddItem("Anne Dodsworth")
	var_Items.CellValue(h0,1,"Sales Representative")
	var_Items.CellValue(h0,2,"London")
oG2antt.EndUpdate()
|
|
1041
|
How can I specify that the list should include any of the seqeunces in the pattern
OleObject oG2antt,var_Columns,var_Items
any h0

oG2antt = ole_1.Object
oG2antt.BeginUpdate()
oG2antt.ColumnAutoResize = true
oG2antt.ContinueColumnScroll = false
oG2antt.FocusColumnIndex = 1
oG2antt.MarkSearchColumn = false
oG2antt.SearchColumnIndex = 1
oG2antt.FilterBarPromptVisible = true
oG2antt.FilterBarPromptType = 2
oG2antt.FilterBarPromptPattern = "london seattle"
oG2antt.Chart.PaneWidth(true,0)
var_Columns = oG2antt.Columns
	var_Columns.Add("Name").Width = 96
	var_Columns.Add("Title").Width = 96
	var_Columns.Add("City")
var_Items = oG2antt.Items
	h0 = var_Items.AddItem("Nancy Davolio")
	var_Items.CellValue(h0,1,"Sales Representative")
	var_Items.CellValue(h0,2,"Seattle")
	h0 = var_Items.AddItem("Andrew Fuller")
	var_Items.CellValue(h0,1,"Vice President, Sales")
	var_Items.CellValue(h0,2,"Tacoma")
	var_Items.SelectItem(h0,true)
	h0 = var_Items.AddItem("Janet Leverling")
	var_Items.CellValue(h0,1,"Sales Representative")
	var_Items.CellValue(h0,2,"Kirkland")
	h0 = var_Items.AddItem("Margaret Peacock")
	var_Items.CellValue(h0,1,"Sales Representative")
	var_Items.CellValue(h0,2,"Redmond")
	h0 = var_Items.AddItem("Steven Buchanan")
	var_Items.CellValue(h0,1,"Sales Manager")
	var_Items.CellValue(h0,2,"London")
	h0 = var_Items.AddItem("Michael Suyama")
	var_Items.CellValue(h0,1,"Sales Representative")
	var_Items.CellValue(h0,2,"London")
	h0 = var_Items.AddItem("Robert King")
	var_Items.CellValue(h0,1,"Sales Representative")
	var_Items.CellValue(h0,2,"London")
	h0 = var_Items.AddItem("Laura Callahan")
	var_Items.CellValue(h0,1,"Inside Sales Coordinator")
	var_Items.CellValue(h0,2,"Seattle")
	h0 = var_Items.AddItem("Anne Dodsworth")
	var_Items.CellValue(h0,1,"Sales Representative")
	var_Items.CellValue(h0,2,"London")
oG2antt.EndUpdate()
|
|
1040
|
How can I specify that all sequences in the filter pattern must be included in the list
OleObject oG2antt,var_Columns,var_Items
any h0

oG2antt = ole_1.Object
oG2antt.BeginUpdate()
oG2antt.Chart.PaneWidth(true,0)
oG2antt.ColumnAutoResize = true
oG2antt.ContinueColumnScroll = false
oG2antt.FocusColumnIndex = 1
oG2antt.MarkSearchColumn = false
oG2antt.SearchColumnIndex = 1
oG2antt.FilterBarPromptVisible = true
oG2antt.FilterBarPromptType = 1
oG2antt.FilterBarPromptPattern = "london manager"
var_Columns = oG2antt.Columns
	var_Columns.Add("Name").Width = 96
	var_Columns.Add("Title").Width = 96
	var_Columns.Add("City")
var_Items = oG2antt.Items
	h0 = var_Items.AddItem("Nancy Davolio")
	var_Items.CellValue(h0,1,"Sales Representative")
	var_Items.CellValue(h0,2,"Seattle")
	h0 = var_Items.AddItem("Andrew Fuller")
	var_Items.CellValue(h0,1,"Vice President, Sales")
	var_Items.CellValue(h0,2,"Tacoma")
	var_Items.SelectItem(h0,true)
	h0 = var_Items.AddItem("Janet Leverling")
	var_Items.CellValue(h0,1,"Sales Representative")
	var_Items.CellValue(h0,2,"Kirkland")
	h0 = var_Items.AddItem("Margaret Peacock")
	var_Items.CellValue(h0,1,"Sales Representative")
	var_Items.CellValue(h0,2,"Redmond")
	h0 = var_Items.AddItem("Steven Buchanan")
	var_Items.CellValue(h0,1,"Sales Manager")
	var_Items.CellValue(h0,2,"London")
	h0 = var_Items.AddItem("Michael Suyama")
	var_Items.CellValue(h0,1,"Sales Representative")
	var_Items.CellValue(h0,2,"London")
	h0 = var_Items.AddItem("Robert King")
	var_Items.CellValue(h0,1,"Sales Representative")
	var_Items.CellValue(h0,2,"London")
	h0 = var_Items.AddItem("Laura Callahan")
	var_Items.CellValue(h0,1,"Inside Sales Coordinator")
	var_Items.CellValue(h0,2,"Seattle")
	h0 = var_Items.AddItem("Anne Dodsworth")
	var_Items.CellValue(h0,1,"Sales Representative")
	var_Items.CellValue(h0,2,"London")
oG2antt.EndUpdate()
|
|
1039
|
How do I change at runtime the filter prompt
OleObject oG2antt,var_Columns,var_Items
any h0

oG2antt = ole_1.Object
oG2antt.BeginUpdate()
oG2antt.ColumnAutoResize = true
oG2antt.ContinueColumnScroll = false
oG2antt.FocusColumnIndex = 1
oG2antt.Chart.PaneWidth(true,0)
oG2antt.MarkSearchColumn = false
oG2antt.SearchColumnIndex = 1
oG2antt.FilterBarPromptVisible = true
oG2antt.FilterBarPromptPattern = "london manager"
var_Columns = oG2antt.Columns
	var_Columns.Add("Name").Width = 96
	var_Columns.Add("Title").Width = 96
	var_Columns.Add("City")
var_Items = oG2antt.Items
	h0 = var_Items.AddItem("Nancy Davolio")
	var_Items.CellValue(h0,1,"Sales Representative")
	var_Items.CellValue(h0,2,"Seattle")
	h0 = var_Items.AddItem("Andrew Fuller")
	var_Items.CellValue(h0,1,"Vice President, Sales")
	var_Items.CellValue(h0,2,"Tacoma")
	var_Items.SelectItem(h0,true)
	h0 = var_Items.AddItem("Janet Leverling")
	var_Items.CellValue(h0,1,"Sales Representative")
	var_Items.CellValue(h0,2,"Kirkland")
	h0 = var_Items.AddItem("Margaret Peacock")
	var_Items.CellValue(h0,1,"Sales Representative")
	var_Items.CellValue(h0,2,"Redmond")
	h0 = var_Items.AddItem("Steven Buchanan")
	var_Items.CellValue(h0,1,"Sales Manager")
	var_Items.CellValue(h0,2,"London")
	h0 = var_Items.AddItem("Michael Suyama")
	var_Items.CellValue(h0,1,"Sales Representative")
	var_Items.CellValue(h0,2,"London")
	h0 = var_Items.AddItem("Robert King")
	var_Items.CellValue(h0,1,"Sales Representative")
	var_Items.CellValue(h0,2,"London")
	h0 = var_Items.AddItem("Laura Callahan")
	var_Items.CellValue(h0,1,"Inside Sales Coordinator")
	var_Items.CellValue(h0,2,"Seattle")
	h0 = var_Items.AddItem("Anne Dodsworth")
	var_Items.CellValue(h0,1,"Sales Representative")
	var_Items.CellValue(h0,2,"London")
oG2antt.EndUpdate()
|
|
1038
|
How do I specify to filter only a single column when using the filter prompt
OleObject oG2antt,var_Columns,var_Items
any h0

oG2antt = ole_1.Object
oG2antt.BeginUpdate()
oG2antt.ColumnAutoResize = true
oG2antt.ContinueColumnScroll = false
oG2antt.FocusColumnIndex = 1
oG2antt.Chart.PaneWidth(true,0)
oG2antt.MarkSearchColumn = false
oG2antt.SearchColumnIndex = 1
oG2antt.FilterBarPromptVisible = true
oG2antt.FilterBarPromptColumns = "2,3"
oG2antt.FilterBarPromptPattern = "london"
var_Columns = oG2antt.Columns
	var_Columns.Add("Name").Width = 96
	var_Columns.Add("Title").Width = 96
	var_Columns.Add("City")
var_Items = oG2antt.Items
	h0 = var_Items.AddItem("Nancy Davolio")
	var_Items.CellValue(h0,1,"Sales Representative")
	var_Items.CellValue(h0,2,"Seattle")
	h0 = var_Items.AddItem("Andrew Fuller")
	var_Items.CellValue(h0,1,"Vice President, Sales")
	var_Items.CellValue(h0,2,"Tacoma")
	var_Items.SelectItem(h0,true)
	h0 = var_Items.AddItem("Janet Leverling")
	var_Items.CellValue(h0,1,"Sales Representative")
	var_Items.CellValue(h0,2,"Kirkland")
	h0 = var_Items.AddItem("Margaret Peacock")
	var_Items.CellValue(h0,1,"Sales Representative")
	var_Items.CellValue(h0,2,"Redmond")
	h0 = var_Items.AddItem("Steven Buchanan")
	var_Items.CellValue(h0,1,"Sales Manager")
	var_Items.CellValue(h0,2,"London")
	h0 = var_Items.AddItem("Michael Suyama")
	var_Items.CellValue(h0,1,"Sales Representative")
	var_Items.CellValue(h0,2,"London")
	h0 = var_Items.AddItem("Robert King")
	var_Items.CellValue(h0,1,"Sales Representative")
	var_Items.CellValue(h0,2,"London")
	h0 = var_Items.AddItem("Laura Callahan")
	var_Items.CellValue(h0,1,"Inside Sales Coordinator")
	var_Items.CellValue(h0,2,"Seattle")
	h0 = var_Items.AddItem("Anne Dodsworth")
	var_Items.CellValue(h0,1,"Sales Representative")
	var_Items.CellValue(h0,2,"London")
oG2antt.EndUpdate()
|
|
1037
|
How do I change the prompt or the caption being displayed in the filter bar
OleObject oG2antt,var_Columns

oG2antt = ole_1.Object
oG2antt.BeginUpdate()
oG2antt.Chart.PaneWidth(true,0)
oG2antt.ColumnAutoResize = true
oG2antt.ContinueColumnScroll = false
oG2antt.FocusColumnIndex = 1
oG2antt.MarkSearchColumn = false
oG2antt.SearchColumnIndex = 1
oG2antt.FilterBarPromptVisible = true
oG2antt.FilterBarPrompt = "changed"
var_Columns = oG2antt.Columns
	var_Columns.Add("Name").Width = 96
	var_Columns.Add("Title").Width = 96
	var_Columns.Add("City")
oG2antt.EndUpdate()
|
|
1036
|
How do I enable the filter prompt feature
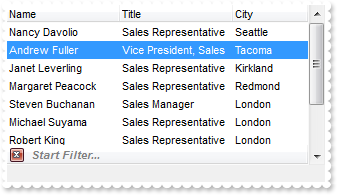
OleObject oG2antt,var_Columns,var_Items
any h0

oG2antt = ole_1.Object
oG2antt.BeginUpdate()
oG2antt.Chart.PaneWidth(true,0)
oG2antt.ColumnAutoResize = true
oG2antt.ContinueColumnScroll = false
oG2antt.FocusColumnIndex = 1
oG2antt.MarkSearchColumn = false
oG2antt.SearchColumnIndex = 1
oG2antt.FilterBarPromptVisible = true
var_Columns = oG2antt.Columns
	var_Columns.Add("Name").Width = 96
	var_Columns.Add("Title").Width = 96
	var_Columns.Add("City")
var_Items = oG2antt.Items
	h0 = var_Items.AddItem("Nancy Davolio")
	var_Items.CellValue(h0,1,"Sales Representative")
	var_Items.CellValue(h0,2,"Seattle")
	h0 = var_Items.AddItem("Andrew Fuller")
	var_Items.CellValue(h0,1,"Vice President, Sales")
	var_Items.CellValue(h0,2,"Tacoma")
	var_Items.SelectItem(h0,true)
	h0 = var_Items.AddItem("Janet Leverling")
	var_Items.CellValue(h0,1,"Sales Representative")
	var_Items.CellValue(h0,2,"Kirkland")
	h0 = var_Items.AddItem("Margaret Peacock")
	var_Items.CellValue(h0,1,"Sales Representative")
	var_Items.CellValue(h0,2,"Redmond")
	h0 = var_Items.AddItem("Steven Buchanan")
	var_Items.CellValue(h0,1,"Sales Manager")
	var_Items.CellValue(h0,2,"London")
	h0 = var_Items.AddItem("Michael Suyama")
	var_Items.CellValue(h0,1,"Sales Representative")
	var_Items.CellValue(h0,2,"London")
	h0 = var_Items.AddItem("Robert King")
	var_Items.CellValue(h0,1,"Sales Representative")
	var_Items.CellValue(h0,2,"London")
	h0 = var_Items.AddItem("Laura Callahan")
	var_Items.CellValue(h0,1,"Inside Sales Coordinator")
	var_Items.CellValue(h0,2,"Seattle")
	h0 = var_Items.AddItem("Anne Dodsworth")
	var_Items.CellValue(h0,1,"Sales Representative")
	var_Items.CellValue(h0,2,"London")
oG2antt.EndUpdate()
|
|
1035
|
How can I unselect all bars
OleObject oG2antt,var_Items

oG2antt = ole_1.Object
oG2antt.Columns.Add("Task")
oG2antt.Chart.FirstVisibleDate = 2001-01-01
var_Items = oG2antt.Items
	var_Items.AddBar(var_Items.AddItem("Task 1"),"Task",2001-01-02,2001-01-04,"K1")
	var_Items.AddBar(var_Items.AddItem("Task 2"),"Task",2001-01-02,2001-01-04,"K2")
	var_Items.AddBar(var_Items.AddItem("Task 3"),"Task",2001-01-02,2001-01-04,"K3")
	var_Items.AddBar(var_Items.AddItem("Task 4"),"Task",2001-01-02,2001-01-04,"K4")
	var_Items.ItemBar(0,"<*>",257,true)
	var_Items.ItemBar(0,"<*>",257,false)
|
|
1034
|
Can I select bars using a pattern using wild characters as *,
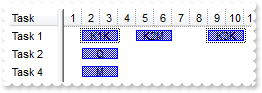
OleObject oG2antt,var_Chart,var_Items
any h

oG2antt = ole_1.Object
oG2antt.Columns.Add("Task")
var_Chart = oG2antt.Chart
	var_Chart.FirstVisibleDate = 2001-01-01
	var_Chart.PaneWidth(false,48)
	var_Chart.ShowNonworkingDates = false
var_Items = oG2antt.Items
	h = var_Items.AddItem("Task 1")
	var_Items.AddBar(h,"Task",2001-01-02,2001-01-04,"K1K","K1K")
	var_Items.AddBar(h,"Task",2001-01-05,2001-01-07,"K2M","K2M")
	var_Items.AddBar(h,"Task",2001-01-09,2001-01-11,"K3K","K3K")
	var_Items.AddBar(var_Items.AddItem("Task 2"),"Task",2001-01-02,2001-01-04,"Q","Q")
	var_Items.AddBar(var_Items.AddItem("Task 4"),"Task",2001-01-02,2001-01-04,"M","M")
	var_Items.ItemBar(0,"<K*K>",257,true)
|
|
1033
|
How can I select all bars in the item with a specified key
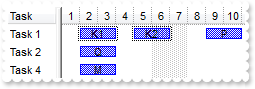
OleObject oG2antt,var_Items
any h

oG2antt = ole_1.Object
oG2antt.Columns.Add("Task")
oG2antt.Chart.FirstVisibleDate = 2001-01-01
oG2antt.Chart.PaneWidth(false,48)
var_Items = oG2antt.Items
	h = var_Items.AddItem("Task 1")
	var_Items.AddBar(h,"Task",2001-01-02,2001-01-04,"K1","K1")
	var_Items.AddBar(h,"Task",2001-01-05,2001-01-07,"K2","K2")
	var_Items.AddBar(h,"Task",2001-01-09,2001-01-11,"P","P")
	var_Items.AddBar(var_Items.AddItem("Task 2"),"Task",2001-01-02,2001-01-04,"Q","Q")
	var_Items.AddBar(var_Items.AddItem("Task 4"),"Task",2001-01-02,2001-01-04,"M","M")
	var_Items.ItemBar(h,"<K*>",257,true)
|
|
1032
|
How can I select all bars in the specified item
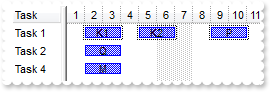
OleObject oG2antt,var_Items
any h

oG2antt = ole_1.Object
oG2antt.Columns.Add("Task")
oG2antt.Chart.FirstVisibleDate = 2001-01-01
oG2antt.Chart.PaneWidth(false,48)
var_Items = oG2antt.Items
	h = var_Items.AddItem("Task 1")
	var_Items.AddBar(h,"Task",2001-01-02,2001-01-04,"K1","K1")
	var_Items.AddBar(h,"Task",2001-01-05,2001-01-07,"K2","K2")
	var_Items.AddBar(h,"Task",2001-01-09,2001-01-11,"P","P")
	var_Items.AddBar(var_Items.AddItem("Task 2"),"Task",2001-01-02,2001-01-04,"Q","Q")
	var_Items.AddBar(var_Items.AddItem("Task 4"),"Task",2001-01-02,2001-01-04,"M","M")
	var_Items.ItemBar(h,"<*>",257,true)
|
|
1031
|
How can I select all bars with a specified key
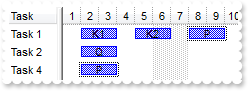
OleObject oG2antt,var_Items
any h

oG2antt = ole_1.Object
oG2antt.Columns.Add("Task")
oG2antt.Chart.FirstVisibleDate = 2001-01-01
oG2antt.Chart.PaneWidth(false,48)
var_Items = oG2antt.Items
	h = var_Items.AddItem("Task 1")
	var_Items.AddBar(h,"Task",2001-01-02,2001-01-04,"K1","K1")
	var_Items.AddBar(h,"Task",2001-01-05,2001-01-07,"K2","K2")
	var_Items.AddBar(h,"Task",2001-01-08,2001-01-10,"P","P")
	var_Items.AddBar(var_Items.AddItem("Task 2"),"Task",2001-01-02,2001-01-04,"Q","Q")
	var_Items.AddBar(var_Items.AddItem("Task 4"),"Task",2001-01-02,2001-01-04,"P","P")
	var_Items.ItemBar(0,"<P>",257,true)
|
|
1030
|
How can I select all bars
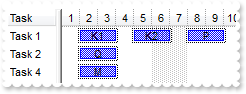
OleObject oG2antt,var_Items
any h

oG2antt = ole_1.Object
oG2antt.Columns.Add("Task")
oG2antt.Chart.FirstVisibleDate = 2001-01-01
oG2antt.Chart.PaneWidth(false,48)
var_Items = oG2antt.Items
	h = var_Items.AddItem("Task 1")
	var_Items.AddBar(h,"Task",2001-01-02,2001-01-04,"K1","K1")
	var_Items.AddBar(h,"Task",2001-01-05,2001-01-07,"K2","K2")
	var_Items.AddBar(h,"Task",2001-01-08,2001-01-10,"P","P")
	var_Items.AddBar(var_Items.AddItem("Task 2"),"Task",2001-01-02,2001-01-04,"Q","Q")
	var_Items.AddBar(var_Items.AddItem("Task 4"),"Task",2001-01-02,2001-01-04,"M","M")
	var_Items.ItemBar(0,"<*>",257,true)
|
|
1029
|
I have the AllowInsideZoom property on True, but I am still not able to use the inside zoom feature
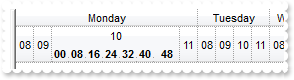
OleObject oG2antt,var_Chart,var_InsideZoomFormat,var_Level

oG2antt = ole_1.Object
oG2antt.BeginUpdate()
var_Chart = oG2antt.Chart
	var_Chart.FirstVisibleDate = 2001-01-01
	var_Chart.PaneWidth(false,0)
	var_Chart.LevelCount = 3
	var_Chart.FirstWeekDay = 1
	var_Chart.Level(0).Label = "Week: <%ww%>"
	var_Level = var_Chart.Level(1)
		var_Level.Label = "<%dddd%>"
		var_Level.Alignment = 1
	var_Chart.Level(2).Label = 65536
	var_Chart.NonworkingHours = 16773375
	var_Chart.ShowNonworkingUnits = false
	var_Chart.ShowNonworkingDates = false
	var_Chart.ShowNonworkingHours = false
	var_Chart.AllowInsideZoom = true
	var_InsideZoomFormat = var_Chart.DefaultInsideZoomFormat
		var_InsideZoomFormat.InsideUnit = 1048576
		var_InsideZoomFormat.InsideLabel = "<b><%nn%></b>"
	var_Chart.InsideZooms.Add(DateTime(2001-01-01,10:00:00))
oG2antt.EndUpdate()
|
|
1028
|
Is there any option to find out if two bars intersects
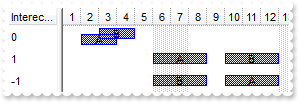
OleObject oG2antt,var_Chart,var_Items
any h

oG2antt = ole_1.Object
oG2antt.BeginUpdate()
oG2antt.DefaultItemHeight = 22
oG2antt.Columns.Add("InterectBars")
var_Chart = oG2antt.Chart
	var_Chart.PaneWidth(false,48)
	var_Chart.FirstVisibleDate = 2001-01-01
	var_Chart.Bars.Item("Task").OverlaidType = 1
var_Items = oG2antt.Items
	h = var_Items.AddItem("")
	var_Items.AddBar(h,"Task",2001-01-02,2001-01-04,"A","A")
	var_Items.AddBar(h,"Task",2001-01-03,2001-01-05,"B","B")
	var_Items.CellValue(h,0,var_Items.IntersectBars(h,"A",h,"B"))
	h = var_Items.AddItem("")
	var_Items.AddBar(h,"Task",2001-01-06,2001-01-09,"A","A")
	var_Items.AddBar(h,"Task",2001-01-10,2001-01-13,"B","B")
	var_Items.CellValue(h,0,var_Items.IntersectBars(h,"A",h,"B"))
	h = var_Items.AddItem("")
	var_Items.AddBar(h,"Task",2001-01-06,2001-01-09,"B","B")
	var_Items.AddBar(h,"Task",2001-01-10,2001-01-13,"A","A")
	var_Items.CellValue(h,0,var_Items.IntersectBars(h,"A",h,"B"))
oG2antt.EndUpdate()
|
|
1027
|
How can I find if a specified hour is a working or non-working hour, when using the ItemNonWorkingUnits
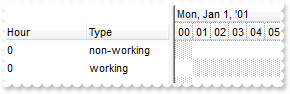
OleObject oG2antt,var_Chart,var_Items
any h,w

oG2antt = ole_1.Object
oG2antt.BeginUpdate()
oG2antt.Columns.Add("Hour").FormatColumn = "hour(value)"
oG2antt.Columns.Add("Type").FormatColumn = "value != 0 ? 'non-working' : 'working'"
var_Chart = oG2antt.Chart
	var_Chart.FirstVisibleDate = 2001-01-01
	var_Chart.PaneWidth(false,164)
	var_Chart.FirstWeekDay = 1
	var_Chart.LevelCount = 2
	var_Chart.UnitScale = 65536
	var_Chart.NonworkingHours = 1
var_Items = oG2antt.Items
	h = var_Items.AddItem(2001-01-01)
	w = oG2antt.Chart.IsNonworkingDate(oG2antt.Items.CellValue(h,0))
	var_Items.CellValue(h,1,w)
	h = var_Items.AddItem(2001-01-01)
	var_Items.ItemNonworkingUnits(h,false,"hour(value) >0 ")
	w = oG2antt.Chart.IsNonworkingDate(oG2antt.Items.CellValue(h,0),h)
	var_Items.CellValue(h,1,w)
oG2antt.EndUpdate()
|
|
1026
|
How can I find if a specified hour is a working or non-working hour
OleObject oG2antt,var_Chart,var_Items
any h,w

oG2antt = ole_1.Object
oG2antt.BeginUpdate()
oG2antt.Columns.Add("Hour").FormatColumn = "hour(value)"
oG2antt.Columns.Add("Type").FormatColumn = "value != 0 ? 'non-working' : 'working'"
var_Chart = oG2antt.Chart
	var_Chart.FirstVisibleDate = 2001-01-01
	var_Chart.PaneWidth(false,164)
	var_Chart.FirstWeekDay = 1
	var_Chart.LevelCount = 2
	var_Chart.UnitScale = 65536
	var_Chart.NonworkingHours = 1
var_Items = oG2antt.Items
	h = var_Items.AddItem(2001-01-01)
	w = oG2antt.Chart.IsNonworkingDate(oG2antt.Items.CellValue(h,0))
	var_Items.CellValue(h,1,w)
	h = var_Items.AddItem(DateTime(2001-01-01,01:00:00))
	w = oG2antt.Chart.IsNonworkingDate(oG2antt.Items.CellValue(h,0))
	var_Items.CellValue(h,1,w)
oG2antt.EndUpdate()
|
|
1025
|
How can I find if a specified date-time is a working or non-working unit, when using the ItemNonWorkingUnits
OleObject oG2antt,var_Chart,var_Items
any h,w

oG2antt = ole_1.Object
oG2antt.BeginUpdate()
oG2antt.Columns.Add("Date").Width = 48
oG2antt.Columns.Add("Type").FormatColumn = "value != 0 ? 'non-working' : 'working'"
var_Chart = oG2antt.Chart
	var_Chart.FirstVisibleDate = 2001-01-01
	var_Chart.PaneWidth(false,128)
	var_Chart.FirstWeekDay = 1
	var_Chart.LevelCount = 2
var_Items = oG2antt.Items
	h = var_Items.AddItem(2001-01-01)
	w = oG2antt.Chart.IsNonworkingDate(oG2antt.Items.CellValue(h,0))
	var_Items.CellValue(h,1,w)
	h = var_Items.AddItem(2001-01-01)
	var_Items.ItemNonworkingUnits(h,false,"weekday(value) in (1)")
	w = oG2antt.Chart.IsNonworkingDate(oG2antt.Items.CellValue(h,0),h)
	var_Items.CellValue(h,1,w)
oG2antt.EndUpdate()
|
|
1024
|
How can I find if a specified date-time is a working or non-working unit
OleObject oG2antt,var_Chart,var_Items
any h,w

oG2antt = ole_1.Object
oG2antt.BeginUpdate()
oG2antt.Columns.Add("Date").Width = 48
oG2antt.Columns.Add("Type").FormatColumn = "value != 0 ? 'non-working' : 'working'"
var_Chart = oG2antt.Chart
	var_Chart.FirstVisibleDate = 2001-01-01
	var_Chart.PaneWidth(false,128)
	var_Chart.FirstWeekDay = 1
	var_Chart.LevelCount = 2
var_Items = oG2antt.Items
	h = var_Items.AddItem(2001-01-01)
	w = oG2antt.Chart.IsNonworkingDate(oG2antt.Items.CellValue(h,0))
	var_Items.CellValue(h,1,w)
	h = var_Items.AddItem(2001-01-06)
	w = oG2antt.Chart.IsNonworkingDate(oG2antt.Items.CellValue(h,0))
	var_Items.CellValue(h,1,w)
oG2antt.EndUpdate()
|
|
1023
|
When zooming to days, the non-working part of the chart occupies some not useful space. Can I reduce it
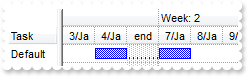
OleObject oG2antt,var_Chart,var_Items,var_Level
any h

oG2antt = ole_1.Object
oG2antt.BeginUpdate()
var_Chart = oG2antt.Chart
	var_Chart.PaneWidth(false,48)
	var_Chart.FirstVisibleDate = 2002-01-03
	var_Chart.Bars.Add("Task:Split").Shortcut = "Task"
	var_Chart.LevelCount = 2
	var_Chart.DrawGridLines = -1
	var_Chart.FirstWeekDay = 1
	var_Chart.Level(0).Label = "Week: <%ww%>"
	var_Level = var_Chart.Level(1)
		var_Level.Label = "<%d%>/<%m2%>"
		var_Level.FormatLabel = "weekday(dvalue) in (0,6) ? 'end' : value"
	var_Chart.UnitWidth = 32
	var_Chart.UnitWidthNonworking = -32
oG2antt.Columns.Add("Task")
var_Items = oG2antt.Items
	h = var_Items.AddItem("Default")
	var_Items.AddBar(h,"Task",2002-01-04,2002-01-08,"A")
oG2antt.EndUpdate()
|
|
1022
|
My chart display only working hours, but when zooming to days, each day shows the non-working part of the day too, even if I use the ShowNonWorkingUnits property on False. What am I doing wrong
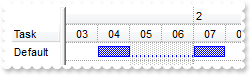
OleObject oG2antt,var_Chart,var_Items,var_Level
any h

oG2antt = ole_1.Object
oG2antt.BeginUpdate()
var_Chart = oG2antt.Chart
	var_Chart.PaneWidth(false,48)
	var_Chart.FirstVisibleDate = DateTime(2002-01-03,10:00:00)
	var_Chart.Bars.Add("Task:Split").Shortcut = "Task"
	var_Chart.LevelCount = 2
	var_Chart.DrawGridLines = -1
	var_Chart.FirstWeekDay = 1
	var_Chart.Level(0).Label = "<%ww%>"
	var_Level = var_Chart.Level(1)
		var_Level.Label = "<%dd%>"
		var_Level.Unit = 65536
		var_Level.Count = 24
	var_Chart.NonworkingHours = 16761855
	var_Chart.ShowNonworkingUnits = false
	var_Chart.ShowNonworkingHours = false
	var_Chart.UnitWidth = 32
oG2antt.Columns.Add("Task")
var_Items = oG2antt.Items
	h = var_Items.AddItem("Default")
	var_Items.AddBar(h,"Task",DateTime(2002-01-04,10:00:00),DateTime(2002-01-08,02:00:00),"A")
	var_Items.ItemBar(h,"A",20,true)
oG2antt.EndUpdate()
|
|
1021
|
I need to display only working hours and weekend part, but for some items I need another non-working part. Is this possible
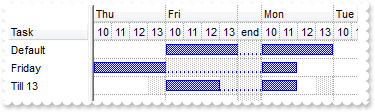
OleObject oG2antt,var_Chart,var_Items,var_Level,var_Level1
any h

oG2antt = ole_1.Object
oG2antt.BeginUpdate()
var_Chart = oG2antt.Chart
	var_Chart.PaneWidth(false,48)
	var_Chart.FirstVisibleDate = 2002-01-03
	var_Chart.Bars.Add("Task:Split").Shortcut = "Task"
	var_Chart.LevelCount = 2
	var_Chart.DrawGridLines = -1
	var_Level = var_Chart.Level(0)
		var_Level.Label = "<%ddd%>"
		var_Level.FormatLabel = "weekday(dvalue) in (0,6) ? '' : value"
	var_Level1 = var_Chart.Level(1)
		var_Level1.Label = 65536
		var_Level1.FormatLabel = "weekday(dvalue) in (0,6) ? 'end' : value"
	var_Chart.NonworkingHours = 16761855
	var_Chart.ShowNonworkingUnits = false
	var_Chart.ShowNonworkingHours = false
	var_Chart.UnitWidthNonworking = -24
oG2antt.Columns.Add("Task")
var_Items = oG2antt.Items
	h = var_Items.AddItem("Default")
	var_Items.AddBar(h,"Task",2002-01-04,2002-01-08,"A")
	var_Items.ItemBar(h,"A",20,true)
	h = var_Items.AddItem("Friday")
	var_Items.AddBar(h,"Task",2002-01-03,DateTime(2002-01-07,12:00:00),"A")
	var_Items.ItemBar(h,"A",20,true)
	var_Items.ItemNonworkingUnits(h,false,"weekday(value) in (0,6,5) or hour(value)<10 or hour(value)>=14")
	h = var_Items.AddItem("Till 13")
	var_Items.AddBar(h,"Task",2002-01-04,DateTime(2002-01-07,12:00:00),"A")
	var_Items.ItemBar(h,"A",20,true)
	var_Items.ItemNonworkingUnits(h,false,"weekday(value) in (0,6) or hour(value)<10 or hour(value)>=13")
oG2antt.EndUpdate()
|
|
1020
|
I can display the working hours, but how can I hide the weekend or non-working part of the chart when using the ShowNonWorkingUnits property on False
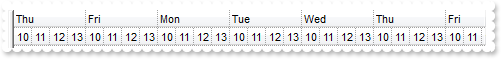
OleObject oG2antt,var_Chart

oG2antt = ole_1.Object
var_Chart = oG2antt.Chart
	var_Chart.PaneWidth(false,0)
	var_Chart.FirstVisibleDate = 2002-01-03
	var_Chart.LevelCount = 2
	var_Chart.Level(0).Label = "<%ddd%>"
	var_Chart.Level(1).Label = 65536
	var_Chart.NonworkingHours = 16761855
	var_Chart.ShowNonworkingUnits = false
	var_Chart.ShowNonworkingDates = false
	var_Chart.ShowNonworkingHours = false
|
|
1019
|
How can I display only the working hours but uses less space for non-working part, such as weekend
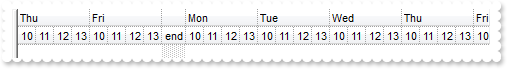
OleObject oG2antt,var_Chart,var_Level,var_Level1

oG2antt = ole_1.Object
var_Chart = oG2antt.Chart
	var_Chart.PaneWidth(false,0)
	var_Chart.FirstVisibleDate = 2002-01-03
	var_Chart.LevelCount = 2
	var_Level = var_Chart.Level(0)
		var_Level.Label = "<%ddd%>"
		var_Level.FormatLabel = "weekday(dvalue) in (0,6) ? '' : value"
	var_Level1 = var_Chart.Level(1)
		var_Level1.Label = 65536
		var_Level1.FormatLabel = "weekday(dvalue) in (0,6) ? 'end' : value"
	var_Chart.NonworkingHours = 16761855
	var_Chart.ShowNonworkingUnits = false
	var_Chart.ShowNonworkingHours = false
	var_Chart.UnitWidthNonworking = -24
|
|
1018
|
How can I display only the working hours but uses less space for non-working part, such as weekend
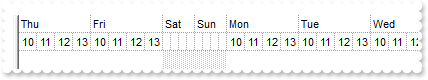
OleObject oG2antt,var_Chart,var_Level

oG2antt = ole_1.Object
var_Chart = oG2antt.Chart
	var_Chart.PaneWidth(false,0)
	var_Chart.FirstVisibleDate = 2002-01-03
	var_Chart.LevelCount = 2
	var_Chart.Level(0).Label = "<%ddd%>"
	var_Level = var_Chart.Level(1)
		var_Level.Label = 65536
		var_Level.FormatLabel = "weekday(dvalue) in (0,6) ? '' : value"
	var_Chart.NonworkingHours = 16761855
	var_Chart.ShowNonworkingUnits = false
	var_Chart.ShowNonworkingHours = false
	var_Chart.UnitWidthNonworking = 8
|
|
1017
|
How can I display only the working hours
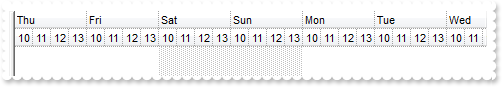
OleObject oG2antt,var_Chart

oG2antt = ole_1.Object
var_Chart = oG2antt.Chart
	var_Chart.PaneWidth(false,0)
	var_Chart.FirstVisibleDate = 2002-01-03
	var_Chart.LevelCount = 2
	var_Chart.Level(0).Label = "<%ddd%>"
	var_Chart.Level(1).Label = 65536
	var_Chart.NonworkingHours = 16761855
	var_Chart.ShowNonworkingUnits = false
	var_Chart.ShowNonworkingHours = false
|
|
1016
|
How can I specify non-working hours
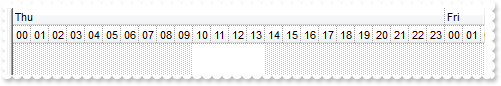
OleObject oG2antt,var_Chart

oG2antt = ole_1.Object
var_Chart = oG2antt.Chart
	var_Chart.PaneWidth(false,0)
	var_Chart.FirstVisibleDate = 2002-01-03
	var_Chart.LevelCount = 2
	var_Chart.Level(0).Label = "<%ddd%>"
	var_Chart.Level(1).Label = 65536
	var_Chart.NonworkingHours = 16761855
|
|
1015
|
How can I display the working hours for a bar
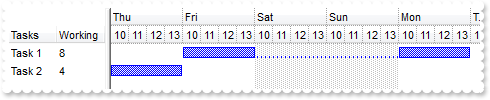
OleObject oG2antt,var_Chart,var_Column,var_Columns,var_Items
any h

oG2antt = ole_1.Object
oG2antt.BeginUpdate()
var_Columns = oG2antt.Columns
	var_Columns.Add("Tasks")
	var_Column = var_Columns.Add("Working")
		var_Column.Def(18,258)
		var_Column.Def(19,"A")
		var_Column.FormatColumn = "(0:=round(value*24)) != 0 ? =:0 : ''"
oG2antt.Items.AllowCellValueToItemBar = true
var_Chart = oG2antt.Chart
	var_Chart.PaneWidth(false,96)
	var_Chart.Bars.Add("Task:Split").Shortcut = "Task"
	var_Chart.FirstVisibleDate = 2002-01-03
	var_Chart.LevelCount = 2
	var_Chart.Level(0).Label = "<%ddd%>"
	var_Chart.Level(1).Label = "<%hh%>"
	var_Chart.NonworkingHours = 16761855
	var_Chart.ShowNonworkingUnits = false
	var_Chart.ShowNonworkingHours = false
var_Items = oG2antt.Items
	h = var_Items.AddItem("Task 1")
	var_Items.AddBar(h,"Task",2002-01-04,2002-01-08,"A")
	var_Items.ItemBar(h,"A",20,true)
	h = var_Items.AddItem("Task 2")
	var_Items.AddBar(h,"Task",2002-01-03,2002-01-04,"A")
	var_Items.ItemBar(h,"A",20,true)
oG2antt.EndUpdate()
|
|
1014
|
Is it possible to show only working hours, showing a small part for the weekend days, and in the same time showing the bars by splitting the non-working part and keeping the working units for the bar while moving
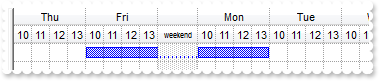
OleObject oG2antt,var_Chart,var_Items,var_Level,var_Level1
any h

oG2antt = ole_1.Object
oG2antt.BeginUpdate()
var_Chart = oG2antt.Chart
	var_Chart.Bars.Add("Task:Split").Shortcut = "Task"
	var_Chart.FirstVisibleDate = 2002-01-03
	var_Chart.DrawGridLines = -1
	var_Chart.GridLineStyle = 512
	var_Chart.PaneWidth(false,0)
	var_Chart.LevelCount = 2
	var_Level = var_Chart.Level(0)
		var_Level.Label = "<%ddd%>"
		var_Level.Alignment = 1
		var_Level.FormatLabel = "weekday(dvalue) in (0,6) ? `` : value"
	var_Level1 = var_Chart.Level(1)
		var_Level1.Label = 65536
		var_Level1.DrawGridLines = true
		var_Level1.FormatLabel = "weekday(dvalue) in (0,6) ? `<font ;6>weekend</font>` : value"
	var_Chart.NonworkingHours = 16761855
	var_Chart.ShowNonworkingUnits = false
	var_Chart.ShowNonworkingDates = true
	var_Chart.ShowNonworkingHours = false
	var_Chart.UnitWidthNonworking = -40
oG2antt.Columns.Add("Task")
var_Items = oG2antt.Items
	h = var_Items.AddItem("Task 1")
	var_Items.AddBar(h,"Task",2002-01-04,2002-01-08,"A")
	var_Items.ItemBar(h,"A",20,true)
oG2antt.EndUpdate()
|
|
1013
|
How can I show bars with different solid color but black border
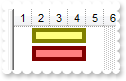
OleObject oG2antt,var_Bar,var_Items
any h

oG2antt = ole_1.Object
oG2antt.BeginUpdate()
oG2antt.VisualAppearance.Add(1,"C:\Program Files\Exontrol\ExG2antt.NET\sample\EBN\blackbox.ebn")
oG2antt.Columns.Add("Task")
oG2antt.Chart.FirstVisibleDate = 2001-01-01
var_Bar = oG2antt.Chart.Bars.Item("Task")
	var_Bar.Color = 16777216 /*0x1000000*/
	var_Bar.Height = 15
oG2antt.Chart.PaneWidth(false,0)
var_Items = oG2antt.Items
	h = var_Items.AddItem("Task")
	var_Items.AddBar(h,"Task",2001-01-02,2001-01-05,"")
	var_Items.ItemBar(h,"",33,65535)
	h = var_Items.AddItem("Task")
	var_Items.AddBar(h,"Task",2001-01-02,2001-01-05,"")
	var_Items.ItemBar(h,"",33,255)
oG2antt.EndUpdate()
|
|
1012
|
I want to display a vertical line for each week, while I still need a vertical separator for each day. Is this possible
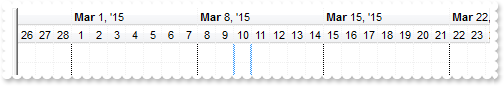
OleObject oG2antt,var_Chart,var_Level,var_Level1

oG2antt = ole_1.Object
oG2antt.GridLineColor = RGB(240,240,240)
var_Chart = oG2antt.Chart
	var_Chart.PaneWidth(false,0)
	var_Chart.DrawGridLines = -1
	var_Chart.NonworkingDays = 0
	var_Chart.LevelCount = 2
	var_Level = var_Chart.Level(0)
		var_Level.DrawGridLines = true
		var_Level.GridLineColor = RGB(0,0,0)
	var_Level1 = var_Chart.Level(1)
		var_Level1.DrawGridLines = true
		var_Level1.GridLineColor = RGB(240,240,240)
|
|
1011
|
How can I display the levels as year, day, AM and PM for each day
OleObject oG2antt,var_Chart,var_Level

oG2antt = ole_1.Object
var_Chart = oG2antt.Chart
	var_Chart.PaneWidth(false,0)
	var_Chart.FirstVisibleDate = 2009-12-01
	var_Chart.UnitWidth = 22
	var_Chart.LevelCount = 3
	var_Chart.Level(0).Label = "<%yyyy%>"
	var_Chart.Level(1).Label = "<%mm%>/<%dd%>"
	var_Level = var_Chart.Level(2)
		var_Level.Label = "<%AM/PM%>"
		var_Level.Count = 12
|
|
1010
|
How can I change the pattern for a specified time unit, in the chart area
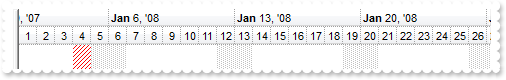
OleObject oG2antt,var_Chart,var_InsideZoomFormat,var_InsideZooms

oG2antt = ole_1.Object
oG2antt.BeginUpdate()
var_Chart = oG2antt.Chart
	var_Chart.PaneWidth(false,0)
	var_Chart.LevelCount = 2
	var_Chart.FirstVisibleDate = 2008-01-01
	var_Chart.AllowInsideZoom = true
	var_Chart.AllowResizeInsideZoom = false
	var_Chart.InsideZoomOnDblClick = false
	var_InsideZoomFormat = var_Chart.DefaultInsideZoomFormat
		var_InsideZoomFormat.PatternChart = 6
		var_InsideZoomFormat.PatternColorChart = RGB(255,0,0)
	var_InsideZooms = var_Chart.InsideZooms
		var_InsideZooms.SplitBaseLevel = false
		var_InsideZooms.DefaultWidth = 18
		var_InsideZooms.Add(2008-01-04).AllowInsideFormat = false
oG2antt.EndUpdate()
|
|
1009
|
How can I hide the non-working hours, but still display the non-working days with even less space
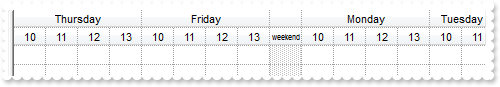
OleObject oG2antt,var_Chart,var_Level,var_Level1

oG2antt = ole_1.Object
oG2antt.BeginUpdate()
var_Chart = oG2antt.Chart
	var_Chart.FirstVisibleDate = 2009-11-19
	var_Chart.DrawGridLines = -1
	var_Chart.GridLineStyle = 512
	var_Chart.PaneWidth(false,0)
	var_Chart.LevelCount = 2
	var_Level = var_Chart.Level(0)
		var_Level.Label = "<%dddd%>"
		var_Level.Alignment = 1
		var_Level.FormatLabel = "weekday(dvalue) in (0,6) ? `` : value"
	var_Level1 = var_Chart.Level(1)
		var_Level1.Label = 65536
		var_Level1.DrawGridLines = true
		var_Level1.FormatLabel = "weekday(dvalue) in (0,6) ? `<font ;6>weekend</font>` : value"
	var_Chart.NonworkingHours = 16761855
	var_Chart.ShowNonworkingUnits = false
	var_Chart.ShowNonworkingDates = true
	var_Chart.ShowNonworkingHours = false
	var_Chart.UnitWidth = 32
	var_Chart.UnitWidthNonworking = -32
oG2antt.EndUpdate()
|
|
1008
|
How can I hide the non-working hours, but still display the non-working days with less space
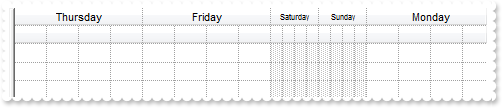
OleObject oG2antt,var_Chart,var_Level,var_Level1

oG2antt = ole_1.Object
oG2antt.BeginUpdate()
var_Chart = oG2antt.Chart
	var_Chart.FirstVisibleDate = 2009-11-19
	var_Chart.DrawGridLines = -1
	var_Chart.GridLineStyle = 512
	var_Chart.PaneWidth(false,0)
	var_Chart.LevelCount = 2
	var_Level = var_Chart.Level(0)
		var_Level.Label = "<%dddd%>"
		var_Level.Alignment = 1
		var_Level.FormatLabel = "weekday(dvalue) in (0,6) ? `<font ;6>` + value + `</font>` : value"
	var_Level1 = var_Chart.Level(1)
		var_Level1.Label = 65536
		var_Level1.DrawGridLines = true
		var_Level1.FormatLabel = "weekday(dvalue) in (0,6) ? `<font ;6>` + value + `</font>` : value"
	var_Chart.NonworkingHours = 16761855
	var_Chart.ShowNonworkingUnits = false
	var_Chart.ShowNonworkingDates = true
	var_Chart.ShowNonworkingHours = false
	var_Chart.UnitWidth = 32
	var_Chart.UnitWidthNonworking = 12
oG2antt.EndUpdate()
|
|
1007
|
How can I hide the non-working hours, but still display the non-working days
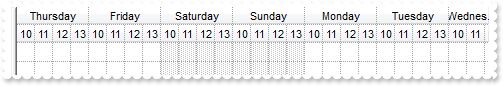
OleObject oG2antt,var_Chart,var_Level,var_Level1

oG2antt = ole_1.Object
oG2antt.BeginUpdate()
var_Chart = oG2antt.Chart
	var_Chart.FirstVisibleDate = 2009-11-19
	var_Chart.DrawGridLines = -1
	var_Chart.GridLineStyle = 512
	var_Chart.PaneWidth(false,0)
	var_Chart.LevelCount = 2
	var_Level = var_Chart.Level(0)
		var_Level.Label = "<%dddd%>"
		var_Level.Alignment = 1
	var_Level1 = var_Chart.Level(1)
		var_Level1.Label = 65536
		var_Level1.DrawGridLines = true
	var_Chart.NonworkingHours = 16761855
	var_Chart.ShowNonworkingUnits = false
	var_Chart.ShowNonworkingDates = true
	var_Chart.ShowNonworkingHours = false
oG2antt.EndUpdate()
|
|
1006
|
How can I hide the non-working hours, and the non-working days
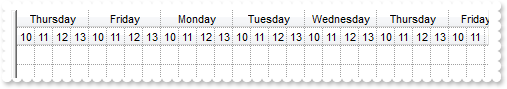
OleObject oG2antt,var_Chart,var_Level,var_Level1

oG2antt = ole_1.Object
oG2antt.BeginUpdate()
var_Chart = oG2antt.Chart
	var_Chart.FirstVisibleDate = 2009-11-19
	var_Chart.DrawGridLines = -1
	var_Chart.GridLineStyle = 512
	var_Chart.PaneWidth(false,0)
	var_Chart.LevelCount = 2
	var_Level = var_Chart.Level(0)
		var_Level.Label = "<%dddd%>"
		var_Level.Alignment = 1
	var_Level1 = var_Chart.Level(1)
		var_Level1.Label = 65536
		var_Level1.DrawGridLines = true
	var_Chart.NonworkingHours = 16761855
	var_Chart.ShowNonworkingUnits = false
	var_Chart.ShowNonworkingDates = false
	var_Chart.ShowNonworkingHours = false
oG2antt.EndUpdate()
|
|
1005
|
Can I highlights the non-working hours while my chart shows days
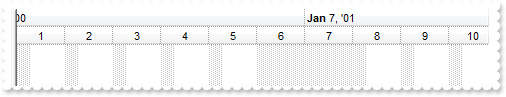
OleObject oG2antt,var_Chart,var_Level

oG2antt = ole_1.Object
var_Chart = oG2antt.Chart
	var_Chart.PaneWidth(false,0)
	var_Chart.FirstVisibleDate = 2001-01-01
	var_Chart.UnitWidth = 48
	var_Chart.LevelCount = 2
	var_Level = var_Chart.Level(1)
		var_Level.Label = "<%d%>"
		var_Level.Unit = 65536
		var_Level.Count = 24
	var_Chart.NonworkingHours = 127
|
|
1004
|
How can I reduce the space/area being occupied by non-working units days or hours (method 2)
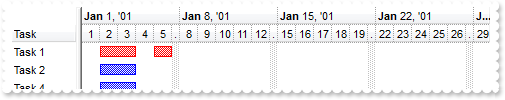
OleObject oG2antt,var_Chart,var_Items
any h

oG2antt = ole_1.Object
oG2antt.BeginUpdate()
oG2antt.Columns.Add("Task")
var_Chart = oG2antt.Chart
	var_Chart.FirstWeekDay = 1
	var_Chart.LevelCount = 2
	var_Chart.FirstVisibleDate = 2001-01-01
	var_Chart.PaneWidth(false,64)
	var_Chart.UnitWidthNonworking = -8
	var_Chart.Level(1).FormatLabel = "weekday(dvalue) in (0,6) ? '.' : value"
var_Items = oG2antt.Items
	h = var_Items.AddItem("Task 1")
	var_Items.AddBar(h,"Task",2001-01-02,2001-01-04,"K1")
	var_Items.AddBar(h,"Task",2001-01-05,2001-01-06,"K2")
	var_Items.AddBar(var_Items.AddItem("Task 2"),"Task",2001-01-02,2001-01-04,"K3")
	var_Items.AddBar(var_Items.AddItem("Task 4"),"Task",2001-01-02,2001-01-04,"K4")
	var_Items.ItemBar(h,"<*>",33,255)
oG2antt.EndUpdate()
|
|
1003
|
How can I reduce the space/area being occupied by non-working units days or hours (method 1)
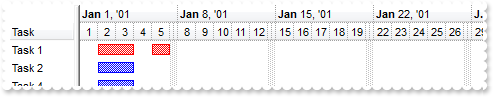
OleObject oG2antt,var_Chart,var_Items
any h

oG2antt = ole_1.Object
oG2antt.BeginUpdate()
oG2antt.Columns.Add("Task")
var_Chart = oG2antt.Chart
	var_Chart.FirstWeekDay = 1
	var_Chart.LevelCount = 2
	var_Chart.FirstVisibleDate = 2001-01-01
	var_Chart.PaneWidth(false,64)
	var_Chart.UnitWidthNonworking = 4
	var_Chart.Level(1).FormatLabel = "weekday(dvalue) in (0,6) ? '' : value"
var_Items = oG2antt.Items
	h = var_Items.AddItem("Task 1")
	var_Items.AddBar(h,"Task",2001-01-02,2001-01-04,"K1")
	var_Items.AddBar(h,"Task",2001-01-05,2001-01-06,"K2")
	var_Items.AddBar(var_Items.AddItem("Task 2"),"Task",2001-01-02,2001-01-04,"K3")
	var_Items.AddBar(var_Items.AddItem("Task 4"),"Task",2001-01-02,2001-01-04,"K4")
	var_Items.ItemBar(h,"<*>",33,255)
oG2antt.EndUpdate()
|
|
1002
|
How can I hide the non-working units
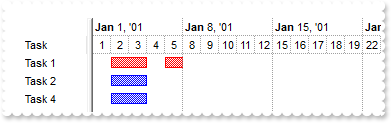
OleObject oG2antt,var_Chart,var_Items
any h

oG2antt = ole_1.Object
oG2antt.BeginUpdate()
oG2antt.Columns.Add("Task")
var_Chart = oG2antt.Chart
	var_Chart.FirstWeekDay = 1
	var_Chart.LevelCount = 2
	var_Chart.FirstVisibleDate = 2001-01-01
	var_Chart.PaneWidth(false,64)
	var_Chart.ShowNonworkingUnits = false
	var_Chart.ShowNonworkingDates = false
	var_Chart.DrawGridLines = 2
	var_Chart.Level(0).DrawGridLines = true
	var_Chart.GridLineStyle = 512
var_Items = oG2antt.Items
	h = var_Items.AddItem("Task 1")
	var_Items.AddBar(h,"Task",2001-01-02,2001-01-04,"K1")
	var_Items.AddBar(h,"Task",2001-01-05,2001-01-06,"K2")
	var_Items.AddBar(var_Items.AddItem("Task 2"),"Task",2001-01-02,2001-01-04,"K3")
	var_Items.AddBar(var_Items.AddItem("Task 4"),"Task",2001-01-02,2001-01-04,"K4")
	var_Items.ItemBar(h,"<*>",33,255)
oG2antt.EndUpdate()
|
|
1001
|
How can I determine that a certain bar is the topmost (zorder)
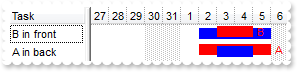
OleObject oG2antt,var_Chart,var_Items
any h

oG2antt = ole_1.Object
oG2antt.BeginUpdate()
oG2antt.Columns.Add("Task")
var_Chart = oG2antt.Chart
	var_Chart.PaneWidth(false,48)
	var_Chart.FirstVisibleDate = 2000-12-27
	var_Chart.Bars.Item("Task").Pattern = 1
var_Items = oG2antt.Items
	h = var_Items.AddItem("B in front")
	var_Items.AddBar(h,"Task",2001-01-02,2001-01-06,"A")
	var_Items.AddBar(h,"Task",2001-01-03,2001-01-05,"B","<fgcolor=FF0000>B</fgcolor>")
	var_Items.ItemBar(h,"B",18,-2)
	var_Items.ItemBar(h,"B",4,18)
	var_Items.ItemBar(h,"B",33,255)
	h = var_Items.AddItem("A in back")
	var_Items.AddBar(h,"Task",2001-01-02,2001-01-06,"A","<fgcolor=FF0000>A</fgcolor>")
	var_Items.ItemBar(h,"A",18,-2)
	var_Items.ItemBar(h,"A",4,18)
	var_Items.ItemBar(h,"A",33,255)
	var_Items.AddBar(h,"Task",2001-01-03,2001-01-05,"B")
oG2antt.EndUpdate()
|